Indicators and tools
The bar's chart type and Indicators keys, and the list on the chart of what is on. Every choice applies as you make it.
Chart type
Eleven ways to draw the bars, in groups: Candles (candles, hollow candles, Heikin-Ashi), Bars (bars, volume candles, high-low), Lines (line, line with markers, step line) and Areas (HLC area, area), and three footprints in a group of their own, Pro. The TPO is an indicator over any of them (below). What colours the candles (the sides' hues, ink, or by session) is the sessions sheet's (The sessions sheet).
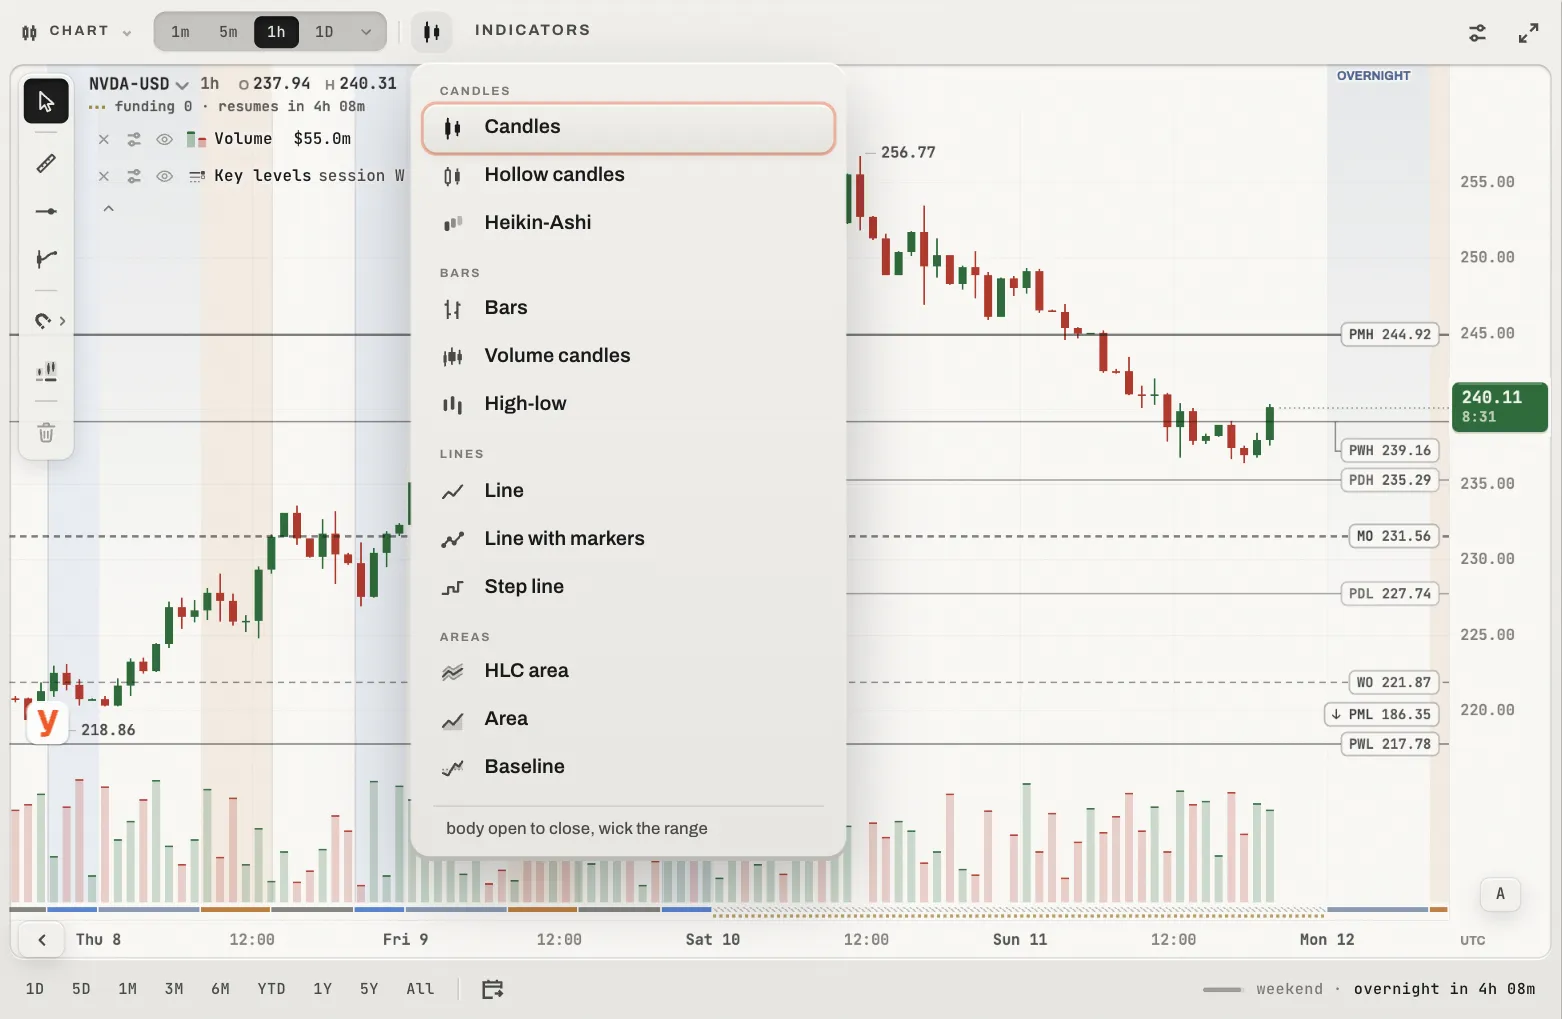
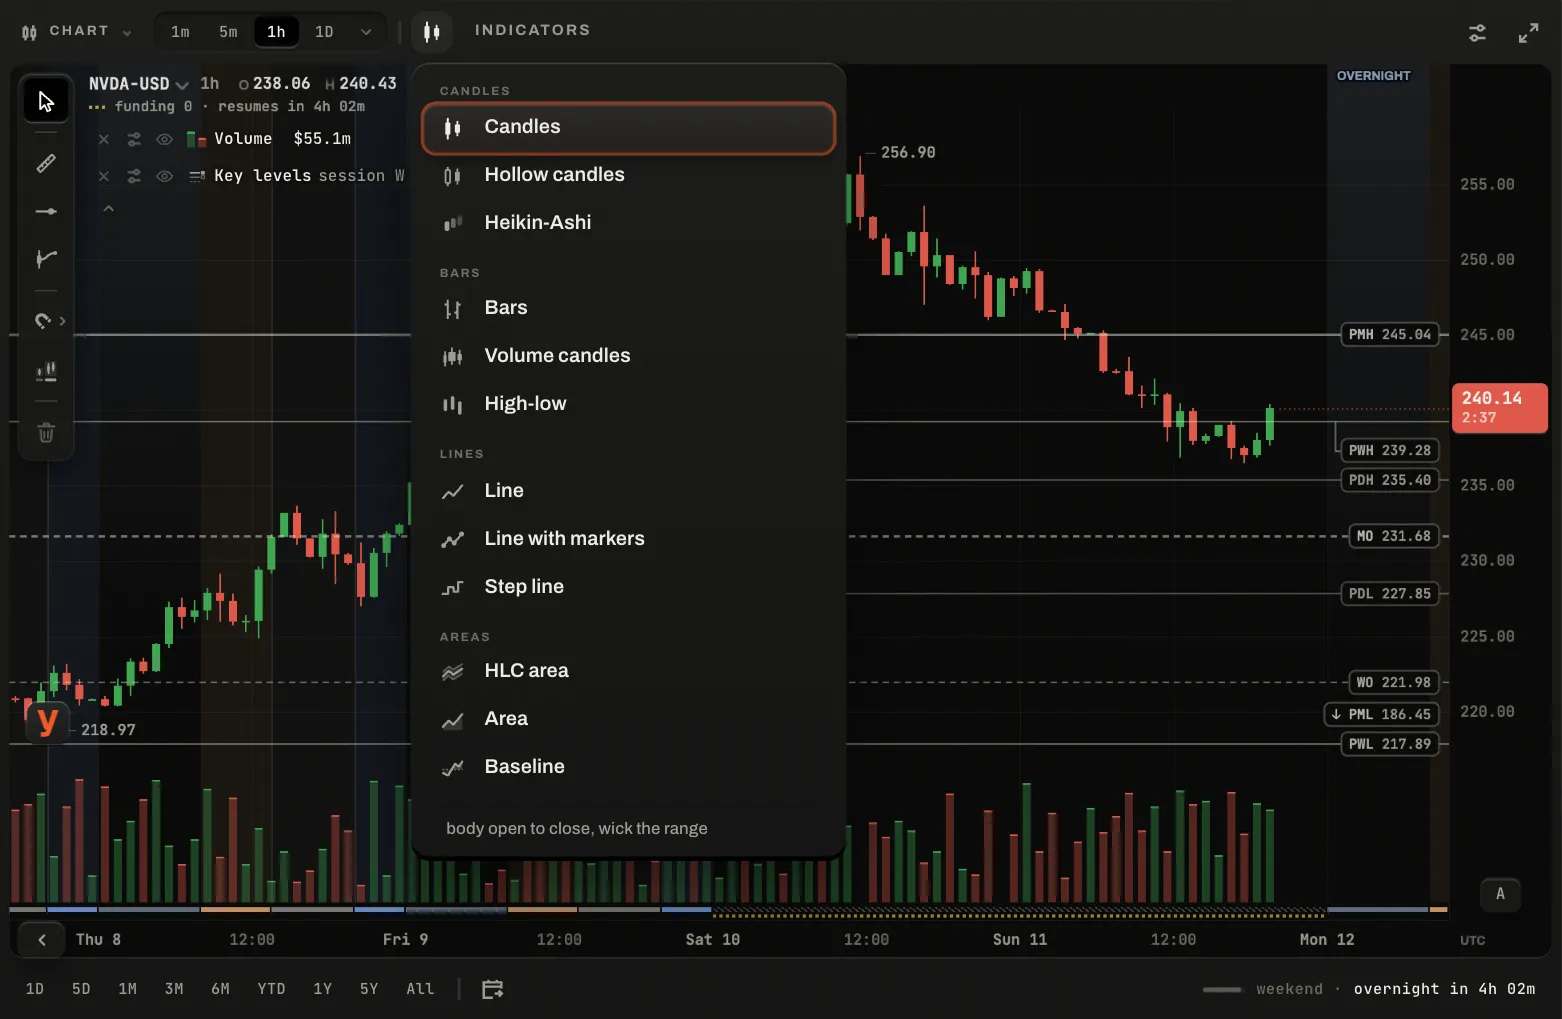
The sheet on Focus's chart, on the sample data: a group a heading.
- Volume candles
- Each body as wide as what its bar traded, against the volume study's own scale.
- Footprint
- A bar opened into its price rows: sold to the left of a spine, bought to the right. Delta shows each price's bought less sold, Heat each price's volume by its shade. Zoomed out a footprint is a candle, and the rows come in as the bar widens, with no step between. The candle is drawn as an outline round the rows from open to close, its wick running to the high and the low under the rows, so the rows stay the loudest thing in the bar. Zoomed out, where the rows are too small to carry their figures, the bar under the hand opens on a small card at the chart's left edge, so it can be read without zooming in; where the rows read on the chart, there is no card. The gear on the footprint's row of the legend opens its own settings: the reading, the candle (an outline, a body, a spine or a slim candle beside the rows), the point of control, the close-up and what stands under each bar.
- A footprint's rows
- A bar is opened only where its rows add up to the notional QFEX reports for that bar; any other is drawn as its candle, filled softly in its colour, with no rows, because a row guessed from a candle would say something untrue. Rows on their way show as faint lines until they land. A minute the tab heard whole is drawn from the tab's own prints, otherwise from QFEX's record of the bar, and the two are never mixed in one bar.
The bars' statistics
Under a footprint, the Bar statistics study adds a table with one column for each bar, exactly beneath it, sliding and zooming with the chart. It exists so the footprint's story can be read across many bars at once, without opening each one.
- Its rows
- CVD, the running sum of bought less sold at the bar's close; Δ, that bar's bought less sold; BUY and SELL, the two sides; and Σ, what the bar traded in all.
- Its shade
- Each cell is shaded by its figure against the largest in view on its row: the rising ink for what was bought, the falling ink for what was sold, ink for the total. Zoomed out, the shades alone read as five quiet strips.
- The forming bar
- The last bar's column fills from its floor as its minute runs, and its figures count up to what the tab has heard.
- Never a zero
- A bar the footprint does not hold is an empty cell, not a 0: a figure QFEX has not shown is not drawn.
- Where the CVD starts
- The CVD starts at the first bar that traded.
TPO
The market profile: how long the market spent at each price, a period at a time, the period being the market's own day. Each 30-minute bracket is a letter, A first, and a row holds every bracket that traded at its price. Zoomed out, days merge into weeks and months.
It is an indicator (Indicators → TPO), so any chart type stands under it: the key on its row beside the eye shows the price or hides it.
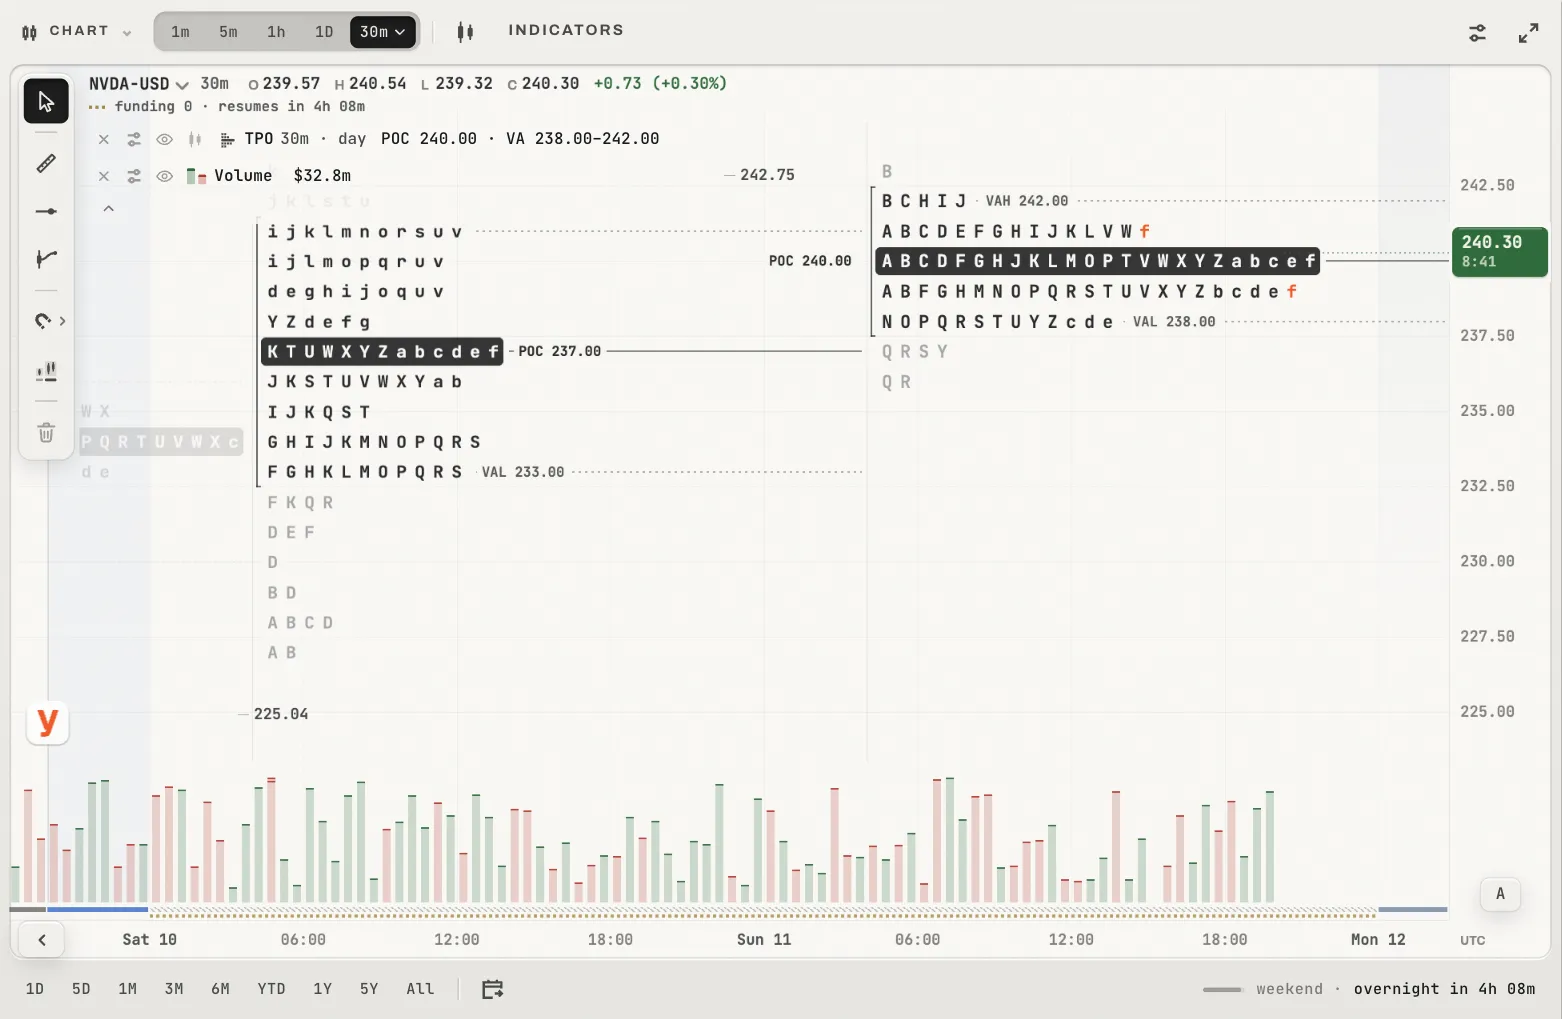
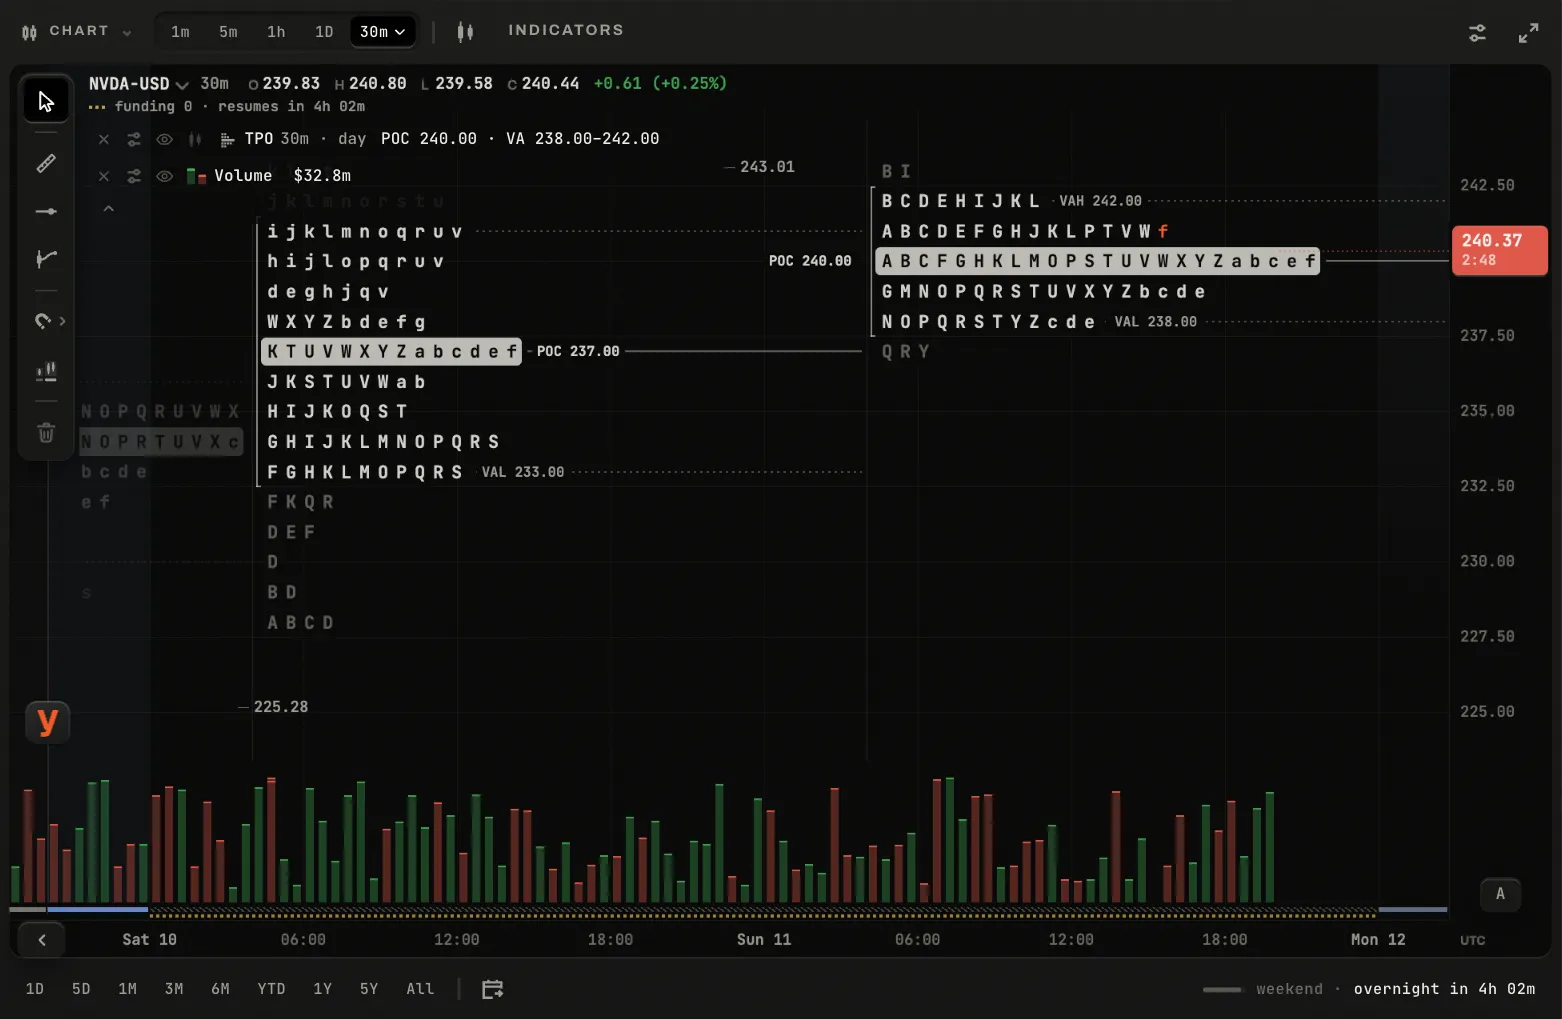
NVDA half an hour a bar on the sample data: a letter each half hour, the value area in full ink, each period's POC a rule named where it has room.
- Its period
- The zoom chooses it — day, week, month — and a small pill over the time axis fills as you keep scrolling until the period changes. Settings → Period holds one period at every zoom instead.
- Its rows
- A row is the profile's own price step, chosen once for the market and the period, so the POC, the value area and the poor highs and lows stay where they are at every zoom.
- Naked POC
- A POC that price has not traded back through since its period, carried to the right edge as
nPOCuntil price comes back to it. - Your fills
- A fill is a small triangle at its price row on the right edge of its period: up for a buy, down for a sell.
- Poor highs · lows
- A period whose top row holds two or more TPOs ended without a single print of excess: the auction did not finish there, and price tends to come back. It is named
poor highorpoor lowand carried right until a bar trades back through it.
Only QFEX's own bars are counted: the history before QFEX keeps its candles. 3M and 1Y offer no profile, the session profiles stand down while it is on, and its × goes back to candles.
Adding a study
The Indicators key lists the studies by name on four shelves: order flow, profiles, averages · levels and context. A study already on the chart sits on a raised plate with a check. A click adds it and lights its new row on the chart, which is where its settings are. Range VP hands you a tool instead; a study that cannot be added now says why. A study is drawn only once the chart holds every bar its value depends on, so a line never moves after it is drawn; until then the chart asks QFEX for the missing stretch.
Each market keeps its own chart: studies, type, scale and timeframe. A market you haven't set up opens with your default (make default, on the indicators sheet), or with the view you were last on.
Volume
What QFEX reports traded in each bar, its notional, as a column under the bars: a study like the others, first on the list and on out of the box.
- Its colour
- The bar's own direction, close against open. It never says who took: QFEX's candles do not say whether a buyer or a seller crossed the spread, so its settings say rising and falling, never buy and sell.
- A scale that holds still
- Set by the closed bars, never the bars on screen: a pan or a zoom never changes a column's height.
A wall plate's volume is one ink. The bars before QFEX carry none: another exchange's shares are not QFEX's notional.
EWMA
One study of up to three exponentially weighted means of the close (20, 50 and 200 out of the box), in heavy, medium and light-dashed ink: a study is not a reading of either side. Its settings add a line and give each its own length, source and look; its row reads each line's length before its value. Each averages the real bars, whatever style draws them.
Session VWAP
The volume-weighted average of a price field since the session began, starting again each day, week or month in the chart's own time zone. Its row reads VWAP day.
Key levels
For each period on (the day, the week and the month out of the box; the quarter and the year when asked), the last period's high and low and this period's open, as quiet rules to the right edge, named there: PDH 232.44. Highs and lows are solid, an open dashed. Each rule starts at the bar that set it, on any timeframe, and from the left edge when that bar is not loaded.
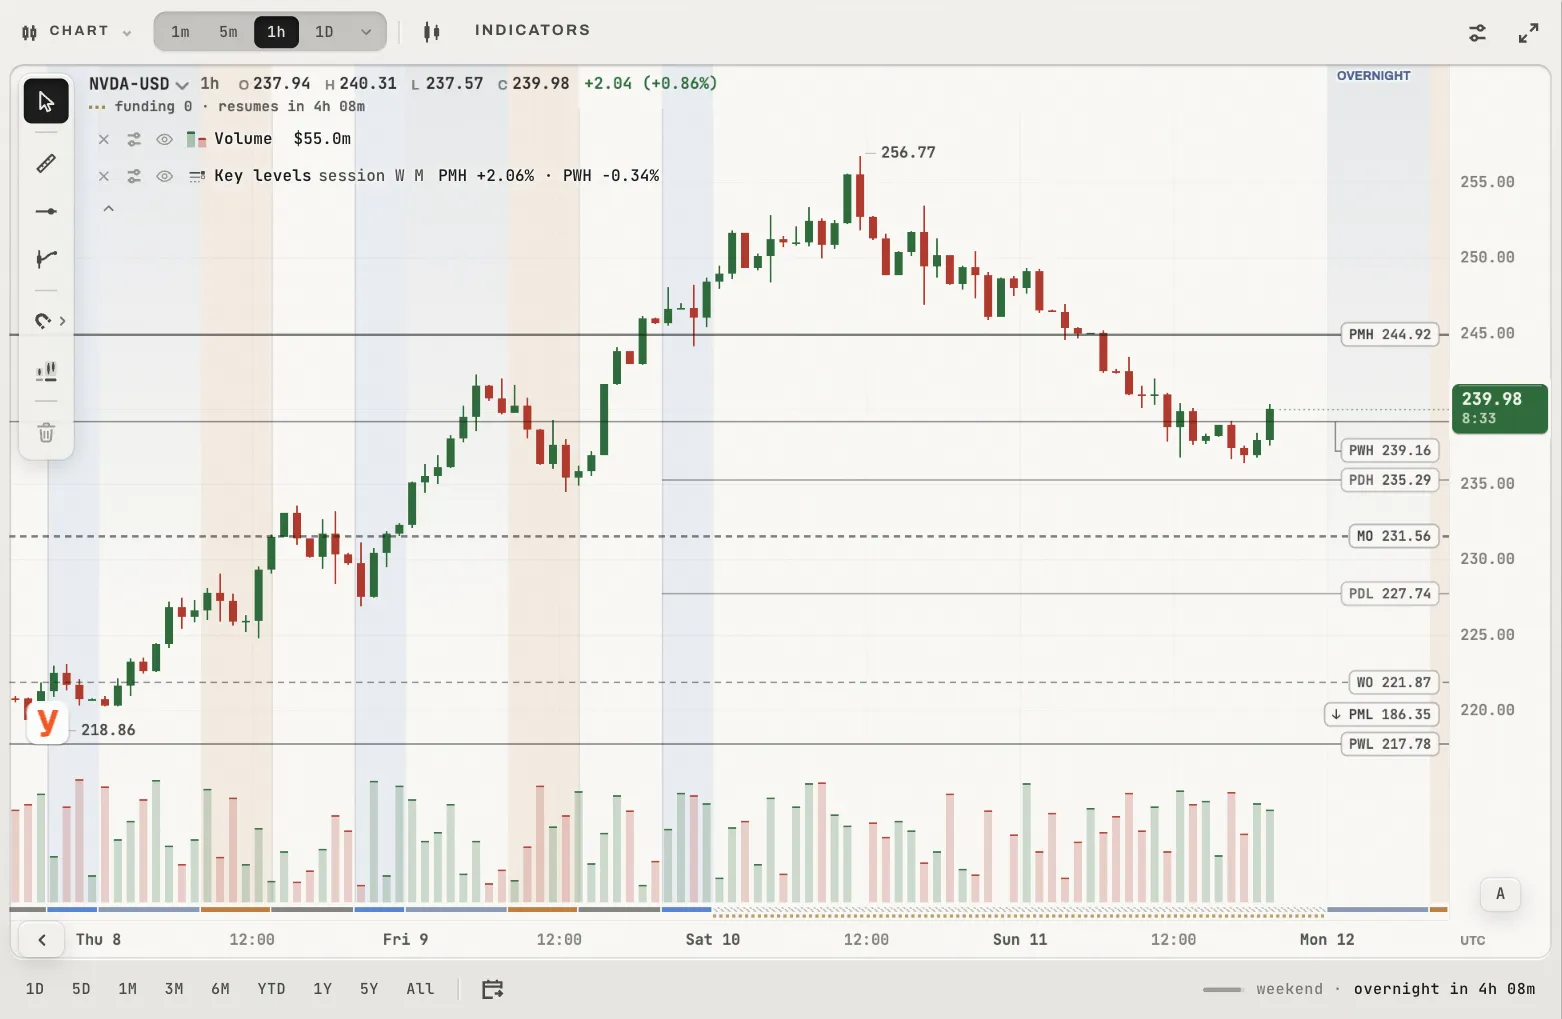
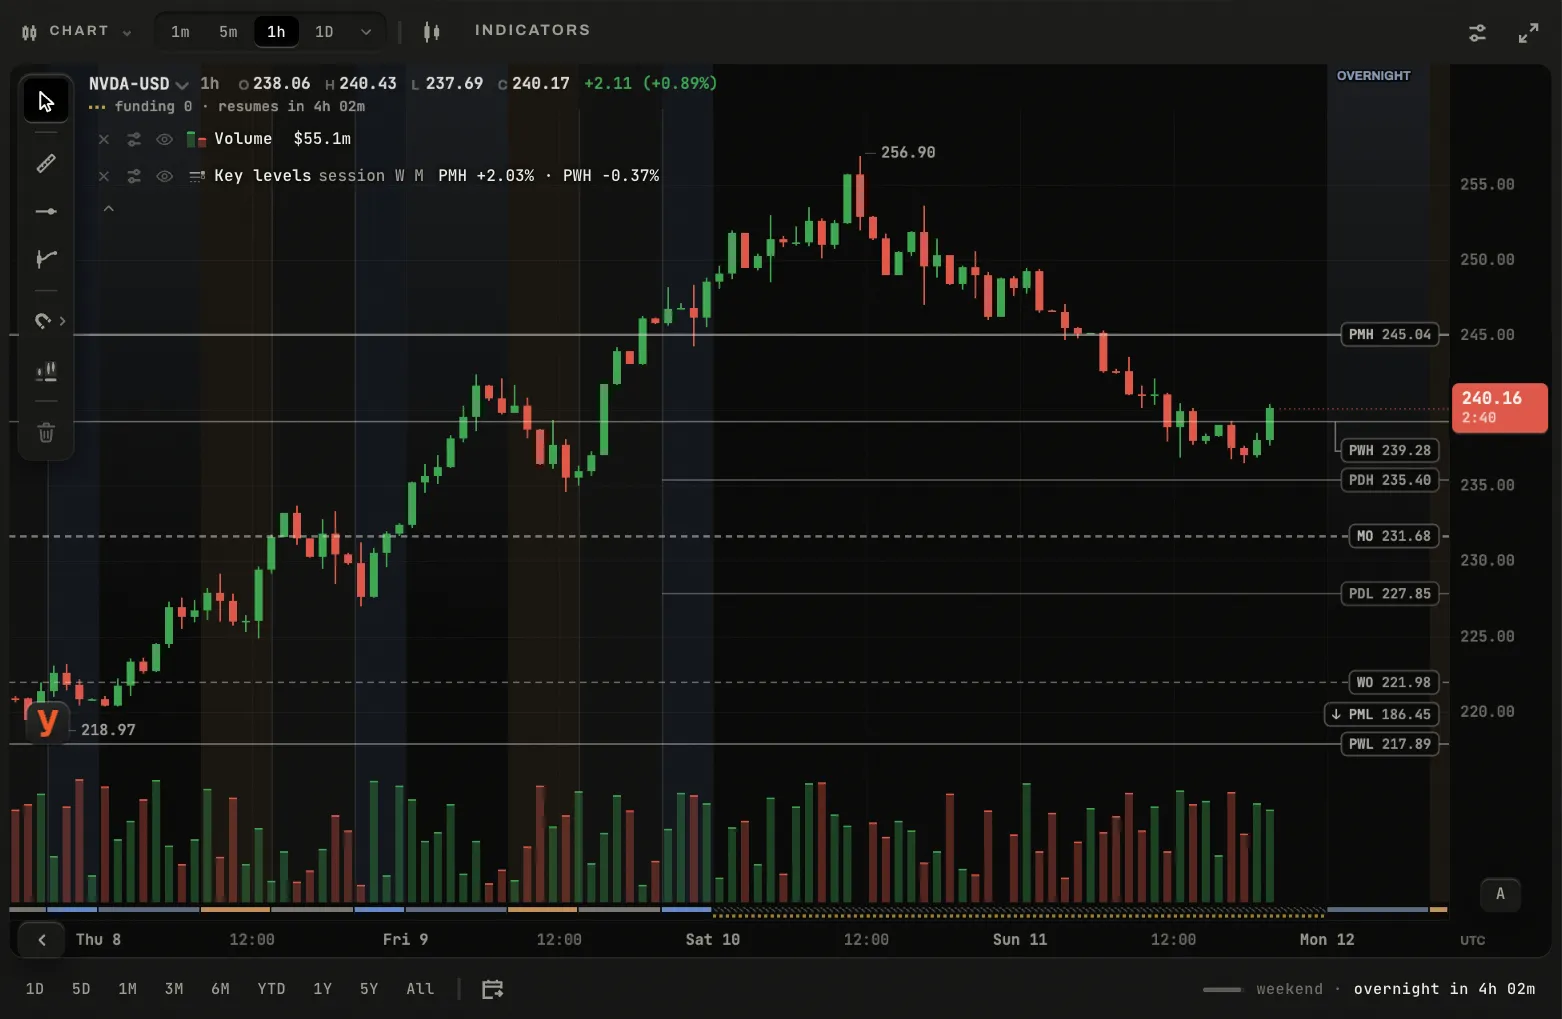
NVDA an hour a bar on the sample data: the prior day's, week's and month's highs and lows and this month's and week's opens, sharing a label where they meet, the prior week's low named at the edge it left by.
- QFEX's own periods
- UTC days, weeks from Monday, calendar months, quarters and years, every hour of them: QFEX trades the weekend, so a Monday's prior day is Sunday and nothing is folded.
- A US name's day
- Its regular session: the last completed session's high, low and close, 09:30 to 16:00 New York, and the session's own 09:30 open while it trades. The study's Day switches it to the UTC day.
Volume profiles
- The visible range
- How much traded at each price over the bars on screen, drawn from the plot's right edge, its point of control a dashed rule, and the value area that holds 70%.
- Each session
- One profile a day, its POC across the day. Intraday timeframes only.
- A selected range
- Range VP, over bars you choose (below); offered while the sessions' profiles are off, since the two would stack.
Range VP
Indicators, then Range VP: drag across the bars, or click the first and the last (⇧ on the last click keeps the tool for another). Inside the region, what traded at each price in two tones, rising and falling bars side by side, with the value area and the POC. Its chip says the bars, how long, the notional and the rising share.
- Removing it
- del, or × on its row with an Undo; the rail's trash takes every drawing at once.
Open interest
A pane between the price and the volume, offered only where the backend serves it. Each bar takes the reading at its own end, the last minute inside it, never an average: a coarse bar says where open interest stood when it closed.
- A range a bar
- Drawn in ink, solid where the bar added open interest and hollow where it shed it, so new money reads against old at a glance. Where only a close a minute is served, the body is the change from the bar before and no wick is drawn, since no high or low is known.
- Gaps
- A minute the record holds no row for is a break in the pane, never a line across it. A window with none says
none recorded in this window; the head says the change over the window.
Notable trades
Indicators, then Notable trades: the largest prints of each minute, one frosted coin each, sized by its notional. A coin stands on its own candle, at the candle's centre and the print's own price, ringed by the ground so a sold coin on a green body still reads sold.
- What is not drawn
- A print outside its candle's high and low, or with no candle, is left out. A coin off its bar would say something the record and the candle disagree about, so the two are never loosened to fit; a stretch nobody heard has no coins and its row says so.
- Under the hand
- A coin lights at its edge and the crosshair snaps to the print's price; its card reads bought or sold, the notional, the size at its price and its millisecond in the chart's zone.
- The filter
- On the indicator's sheet: a floor drawn over the window's own distribution of prints (bought above the line, sold below; what the floor leaves out is dimmed, never hidden), the side, how many a candle, and how large the largest coin grows. The legend's row says the side, the floor and the count kept.
Compare
A circled + after the timeframe's word on the legend line opens a picker of QFEX's markets; the circle opens into the panel and folds back into it. Up to two markets can be set against the one you read, each as a line of its move, drawn under the candles so another market never crosses a candle. A third pick takes the place of the older one and keeps its colour. Full charts only, never a wall's small ones.
- One start for every line
- The first compare turns the price scale to percent, and the last one taken away gives the old scale back. Each line is rebased to the chart's close at the first bar in view, so they all read their own move from the same start.
- It waits for a pan to end
- The start moves only when the chart is at rest, then the lines glide to it on the scale's own spring. While your hand, a throw or a zoom is moving it, the start holds, so a pan carries the lines with the candles and the scale does not jump as each bar crosses the edge.
- A market that began later
- Its line starts where its bars do, and its figures stay hidden while its past is still being read: its move from the start is not known yet, and a figure from a false start would jump when the past landed. Its past is asked ahead of your hand.
- Its row
- On the list: its colour as the swatch and its move under the hand as the value; the eye hides it, the gear sets its colour, the × takes it off.
The history from before QFEX is never compared, and a line breaks across a stretch with no bar.
The list on the chart
Every indicator that is on is a row at the plot's top-left, under the legend: its name and numbers (VWAP day, VPVR 70%) and its value on the bar the legend reads. × takes it off, the settings key (or a double-click) opens its settings, the eye hides it and keeps the row; a gold mark says why one cannot compute.
A study's settings
One sheet for every indicator: what it computes, then how it looks. OK or Enter keeps a change, Esc puts back what it was.
A line's colour is ink, soft ink or blue: never the sides' green and red, the gold of a threshold or the orange of an act. The volume is the one study in the sides' hues, because its colour states a fact about each bar.
Sessions
- By colour
- Each candle takes its session's treatment of the sides' colours, chosen per session; a rising bar still reads as rising in every one.
- By box
- Each session's high and low in a box over its own candles, or the ribbon on the time axis; or both; or neither.
Both are set in the sessions sheet on the rail (The sessions sheet).
Tools
Four tools and nothing else: the ones that answer a question about price. On Focus three stand on a rail floating over the chart's left edge; the fourth, Range VP, is picked from the Indicators key. Drawings are the market's, anchored by price and time, and drawn in ink.
The rail
- The pointer
- The chart's own hand. Placing a drawing puts the tool down (hold ⇧ to keep it), and so does esc.
- Measure · line · anchored VWAP
- The three drawing tools; the one in your hand is pressed.
- Magnet
- A press turns the snap off, and on again at its last strength; the chevron at its edge opens off, weak and strong (below).
- Sessions
- Opens the sessions sheet (The sessions sheet).
- The trash
- Every drawing on this market away at once, with an Undo for five seconds.
- Where
- Focus's chart only. A phone keeps the same acts in one tools key in the chart's bar; the wall's plates have no tools.
Measure
Drag across a move, or click where it starts and where it ends: the span between the two bars and the two prices, and one chip with the change and its percent (−2.13 −0.89%) over the bars and how long (51 bars · 4h 15m). The next click puts it away.
Horizontal line
Click a price: the line drags to move and carries its price on the scale.
Anchored VWAP
Click the bar it starts from: it runs from there to now, the volume-weighted average price of everything traded since. Drag its anchor to another bar; its line ends at a minute the backend's collector missed.
The magnet
- Off
- Out of the box: the crosshair and every tool go exactly where the pointer is; hold ⌘ (Ctrl elsewhere) to snap for a moment.
- Weak
- Snaps to a bar's open, high, low or close when the pointer is near.
- Strong
- Always to the nearest of them.
An order is never snapped: it goes where you point.
Taking one away
Drawings are kept per market with your settings; the manual's chart clears its own when you leave the page.