The candle chart
One chart engine everywhere a candle is drawn: Focus's chart, every chart plate on the wall, It draws every trade into its bar as it lands, goes where your hand takes it, and puts your position and orders on the price.
Its bar
From the left: your pinned timeframes and a chevron to all twenty-one (Timeframes), the chart type (Chart type), Indicators (Adding a study), and at the right edge the settings and full screen. The tools stand on a rail down the left edge (Tools); the ranges, the calendar and the session in a strip under the time axis (The range bar).
Reading it
- The legend
- The market, the timeframe, the bar's open, high, low and close and its own move from the bar before (never a day's change); under it QFEX's funding (
funding on · pauses in 5h 46m) and a row for each indicator that is on. - The market's name
- On Focus the legend's first word is a key: it opens the finder, and a market picked there takes the chart's place.
- The tag
- The last price on the scale, in its tick's colour, with a countdown to the bar's close. While the chart is catching up it greys: until QFEX answers it is the last price heard, not the present.
- The crosshair
- Its time names the session it falls in and how far that moment is from now:
5h 12m ago,in 19h 58m,nowon the forming bar. Pointing at a heatmap on the same page draws it at the same time and price. - The zone
- The chip under the price scale names the zone the axis is written in: the terminal's (
UTC+9) or the market's own (ET), as the sessions sheet chooses (One time zone).
Waiting, and never stale
- Loading
- Fine dots over the well and one chip saying what the chart waits for. No candle is drawn until QFEX's bars land.
- Older history
- Pan back and older bars are asked ahead of you, a chip saying how far back the chart reaches. The view never goes into empty time.
- Coming back
- A tab left in the background says so on its first frame back (
updating · 14m behind) and fills the missed candles in from QFEX. A closed candle never changes, so a chart opened again asks QFEX only for the ones since. A machine that slept never has a day-old picture drawn as now. - Live paused
- While the link to QFEX is down, or reconnecting, and the forming candle has taken no price for four seconds, the candle loses its hue and a chip reads
live paused · price 12s old. It clears the moment the link is back, and never shows while it is up: QFEX's marks come seconds apart, and a quiet market's still candle is still the price. - When QFEX does not answer
- The chip says why in words (
QFEX not answering,backend unreachable,QFEX busy,offline), its ring running down to the next try; a press tries now. - QFEX's bars, every one
- Every closed candle is QFEX's own record within seconds of its close, never the copy drawn while it formed. A minute with no volume bar is one QFEX reports with no trades, and the legend says
no prints; while the minute forms it saysnone yet.
Your hand on it
- Auto, or yours
- A sideways drag never touches the price scale. A vertical drag takes it off auto (○ auto off): press the key, or double-click the scale, to give the range back to the market.
- ⇧ never measures
- ⇧ is the key that takes the market; a ⇧-drag pans like any other.
The chart's keys answer while its well has the keyboard (a click in it gives it).
The price scale
One key at the scale's foot wears the scale in force: A auto (linear, fitted to the bars on screen), L log (equal distances are equal ratios, so a 10% move is as tall at any price), % percent from the first bar on screen. A new market or timeframe starts on auto, so a range you set on the last one is not carried.
The range bar
Under the time axis: 1D 5D 1M 3M 6M YTD 1Y 5Y All, each a period on the timeframe that suits it, fitted and ending now, because the period is the question (what did it do this month) and the timeframe is part of the answer.
- Its tip says what you get
1 month in 30 minute intervals; a range with more bars than the chart can show uses the next coarser timeframe, and the tip says so.- The session, at its end
- The session in force and its turn:
regular · closes in 2h 14m,pre-market · regular in 1h 10m. Pressed, every session with its hours and a live countdown; a market that trades round the clock lists its own state, then Sydney, Tokyo, London and New York at their exchanges' hours.
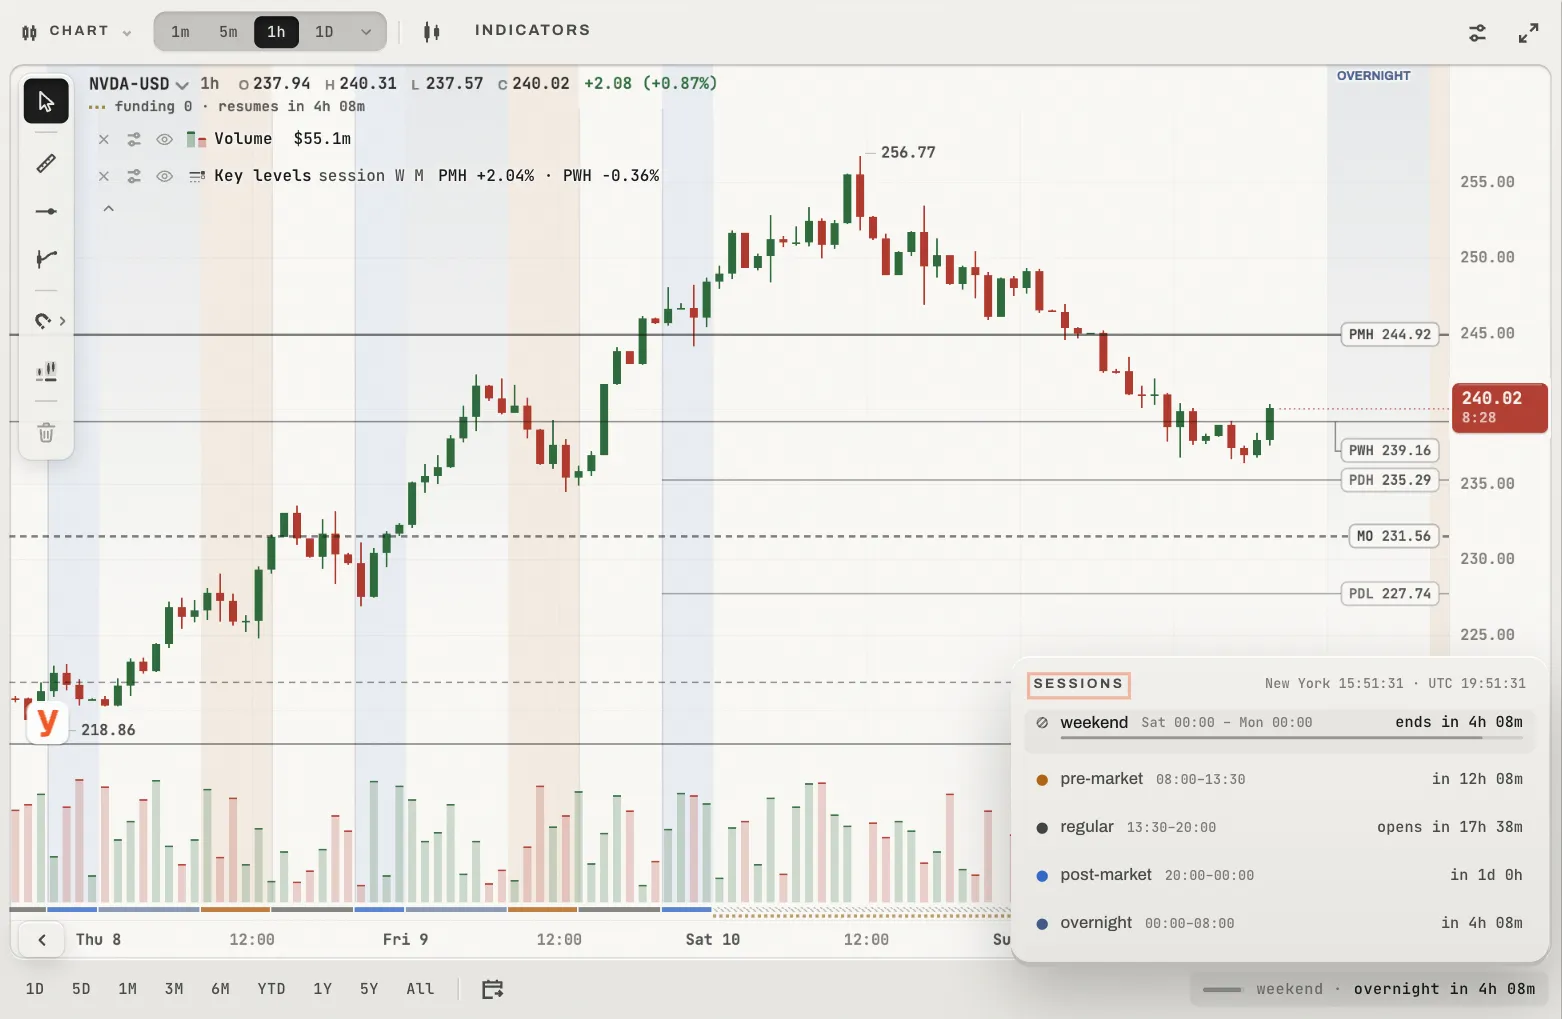
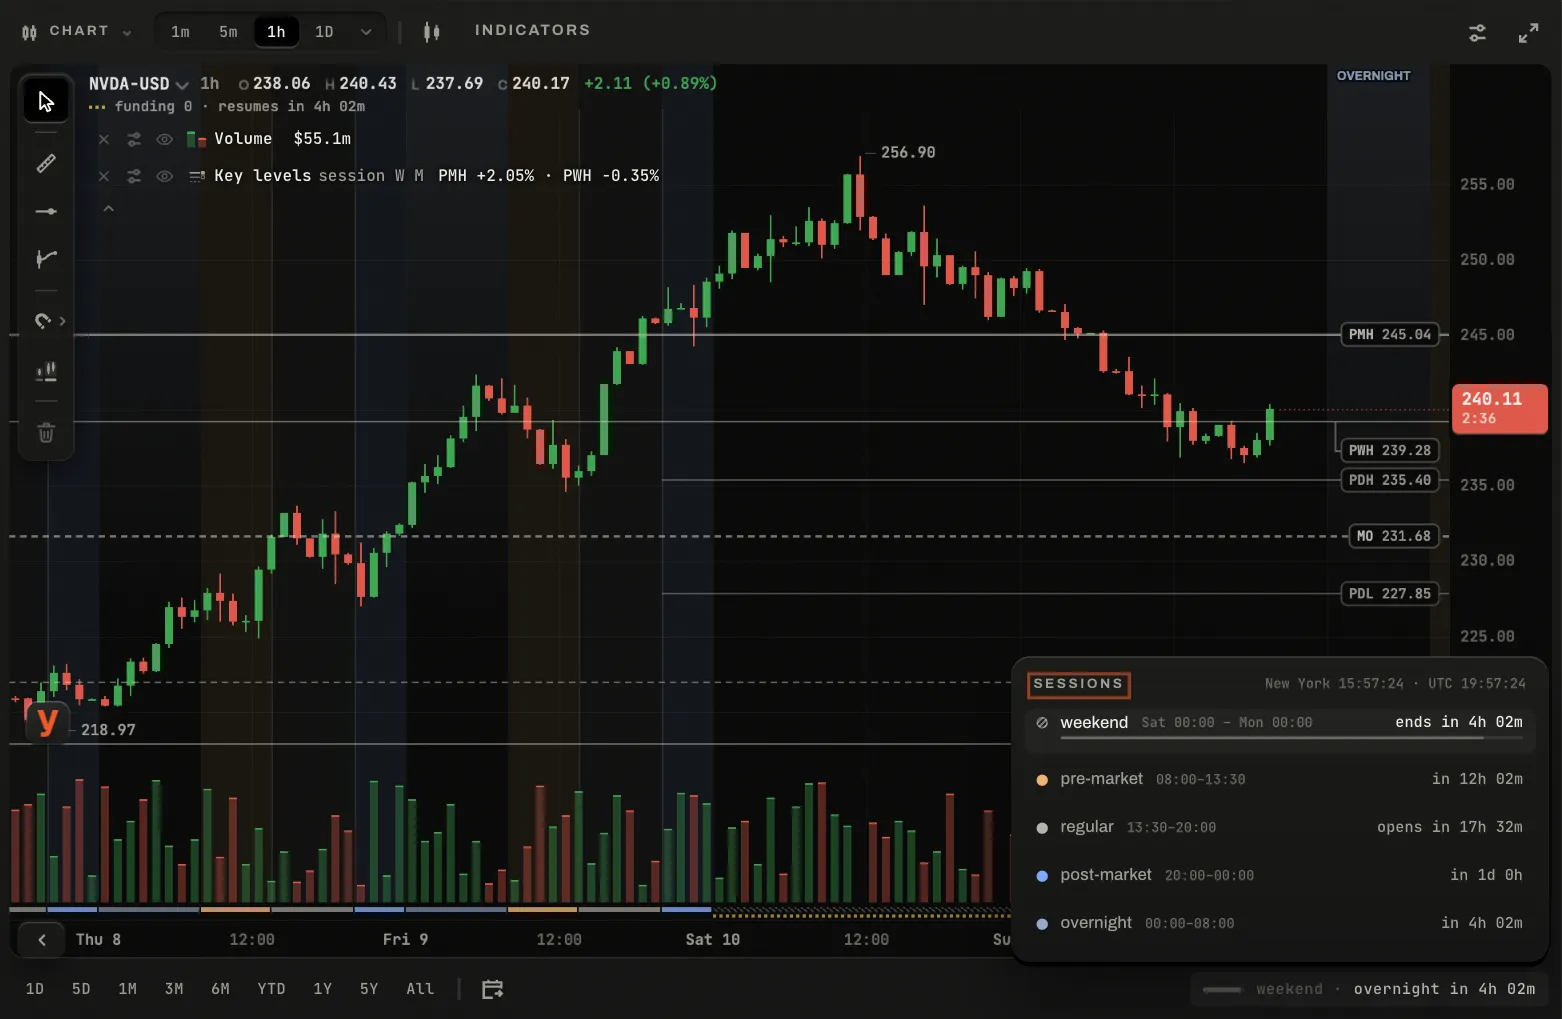
NVDA on the sample data: every session with its hours and its countdown, the one in force lifted with its progress.
Go to a date
The calendar at the strip's end shows a chosen day's trades, on the finest timeframe whose history reaches it. A day before QFEX listed the market opens on daily bars, in the history before QFEX. Its foot says what a day will show before you go: Mon 5 Oct 2026 · on 2m · 720 bars · weekend, and a time can be typed.
The chart's settings
The settings key at the bar's right end opens a sheet in groups. Every row is kept for this chart and applies as you set it.
Each setting has one home: the volume's are on its own row in the chart's list (Volume), the hours and the zone are the sessions sheet's, the magnet is the rail's.
Full screen
- On Focus
- The bar's last key: the chart fills the window and keeps its tools, its drawings and the view you were reading. ⇧-click gives it the whole window, the bar too; esc puts it back.
- A wall plate
- Its chart carries the same key in its top-right corner, and its way back names the page (
back to the wall · Esc).
Where it is drawn
- Focus
- The full chart, with its bar, legend, tools, profiles and your trading on it.
- A wall plate
- The same engine cut to the plate: bars, the tag, the hours, its volume in one ink, and everything you hold on the market, which you adjust from the plate. The wall's linked crosshair draws the moment under the pointer on every other plate (Three faces).
Timeframes
QFEX publishes candles at eight resolutions. The chart offers twenty-one: the eight, and thirteen more each built from QFEX's own candles, never a bar the venue did not print. The bar carries the ones you pin.
- Pinned
- One to five on the bar, shortest first (1m, 5m, 1h, 1D out of the box); a timeframe you have not pinned stands among them in its place while it is on screen, so pinning it moves nothing.
- At the zoom's end
- Zoomed fully out, a push keeps filling a pill toward the next coarser timeframe on your ladder; fully in, toward the next finer. Let go half way and the pill drains back to zero smoothly, never rising. A press on a step goes there, and the candles fold into the next or split into the finer. Candles only; Settings → Scale turns the stepping off.
- All twenty-one
- The chevron opens them; a star pins or unpins one, and never changes the chart. A built one wears a dot under its name; its tip says what it is built from.
Orders on the chart
Your trading drawn where it matters, on the price: the position with its entry and P&L, its take-profit and stop-loss as handles, every working order with its own tag, every fill as a B or an S on its bar, and the liquidation price, always. Nothing is drawn of an order you have not placed.
What is drawn
- Position
- A line at the entry with a tag: the side, the size and the open P&L, live with the mark, ending in the red nuke that closes it, asked first with what it would do. Pull a take-profit or a stop out of its tag.
- TP and SL
- Their own lines with tags you drag, each ending in the gold cap that takes it off. Each must stand beyond the mark on its own side (a long's take-profit above it, its stop below): carried past it, the tag stops at the last price it may take, a chip beside it says why (
below 239.63), and let go there nothing changes. - An order
- One line and one tag, with the gold cap that cancels it at once. Drag it to move it; click the tag to type a price.
- A stop limit
- Its line stands at its trigger, where it acts; its limit is a second, quieter line leashed to it (
LMT 241.60), moved on its own while the trigger keeps its place. - A scale
- While you set one, a spine and its orders, each as long as its size, with FROM and TO handles: the one thing of an order not yet placed the chart draws.
- Fills
- A B under the candle a buy happened in, an S over it for a sell, a count where several share a bar, and two short ears at the average price.
- Liquidation
- Always drawn, dashed and gold, with the doomed side shaded.
- Off the range
- A line above or below what is on screen becomes a pill at the edge, so nothing you own is ever out of sight.
A click on the price
A plain click reads the chart and leaves the ticket as it is. Select a price field of the ticket (a limit's price, a scale's From and To, a stop's trigger, a take-profit or a stop-loss) and a click writes the price under the pointer into it, at the market's tick; while you point, the field's name and that price ride the pointer (Price 239.85). Armed, the click places the ticket's order and the words say it (BUY STOP 240.64, or where a stop may not stand, SELL STOP 240.24 · below 240.20; Click, fill, arm). The right-click menu offers a limit at the price.
A drag is a request
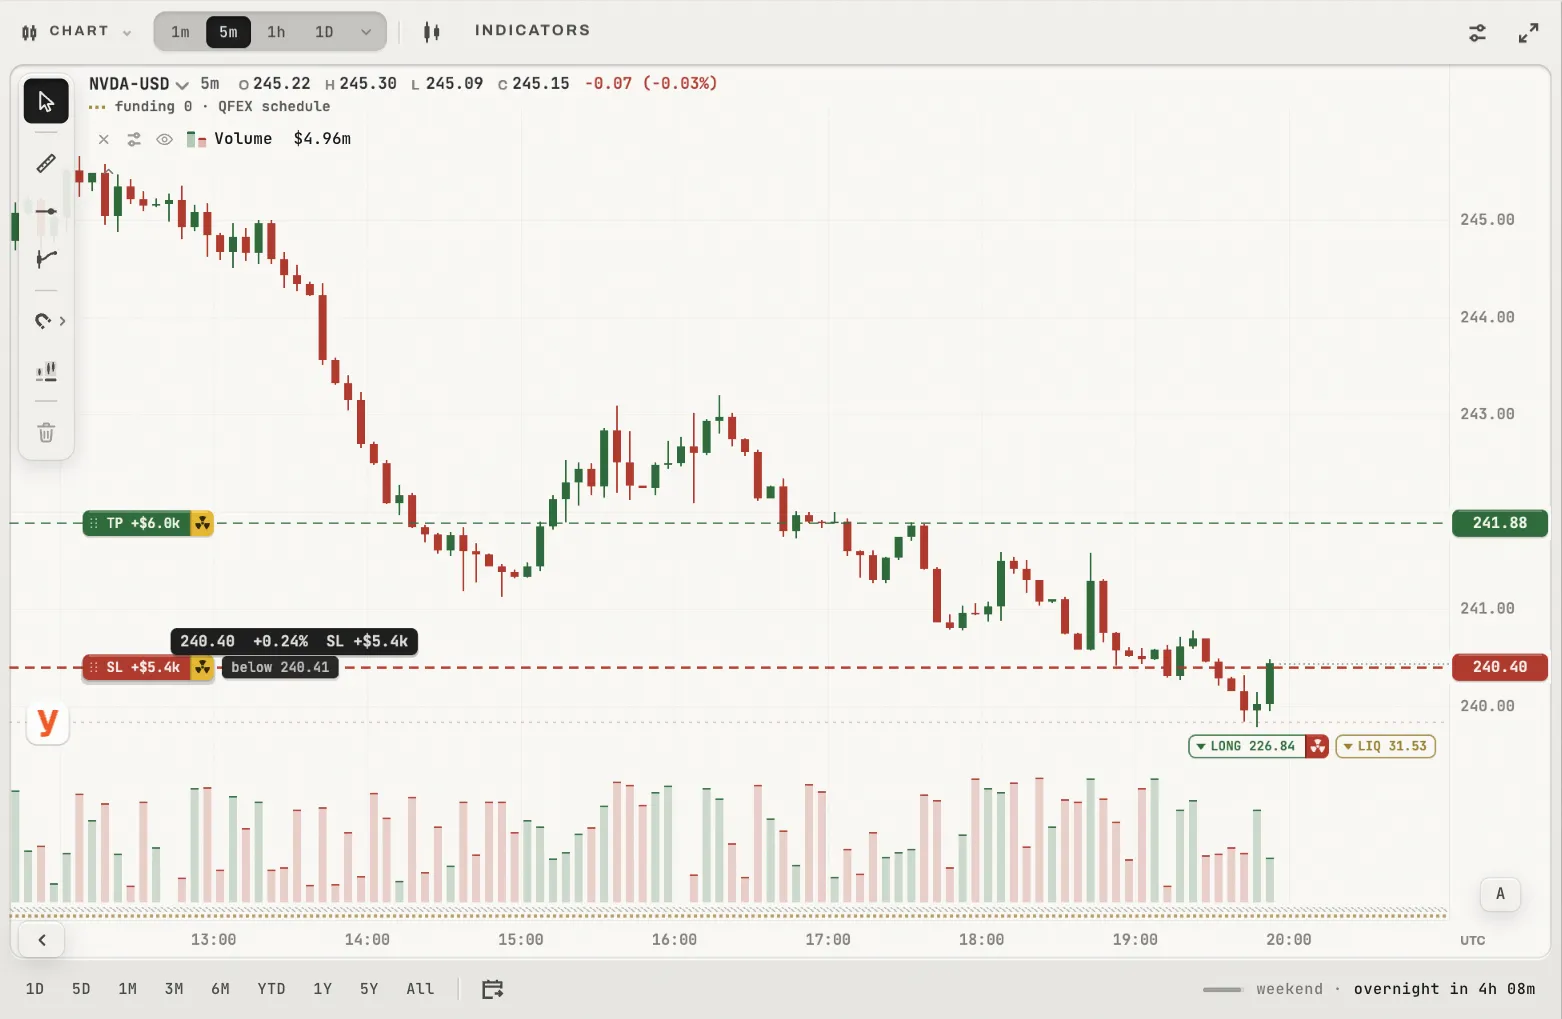
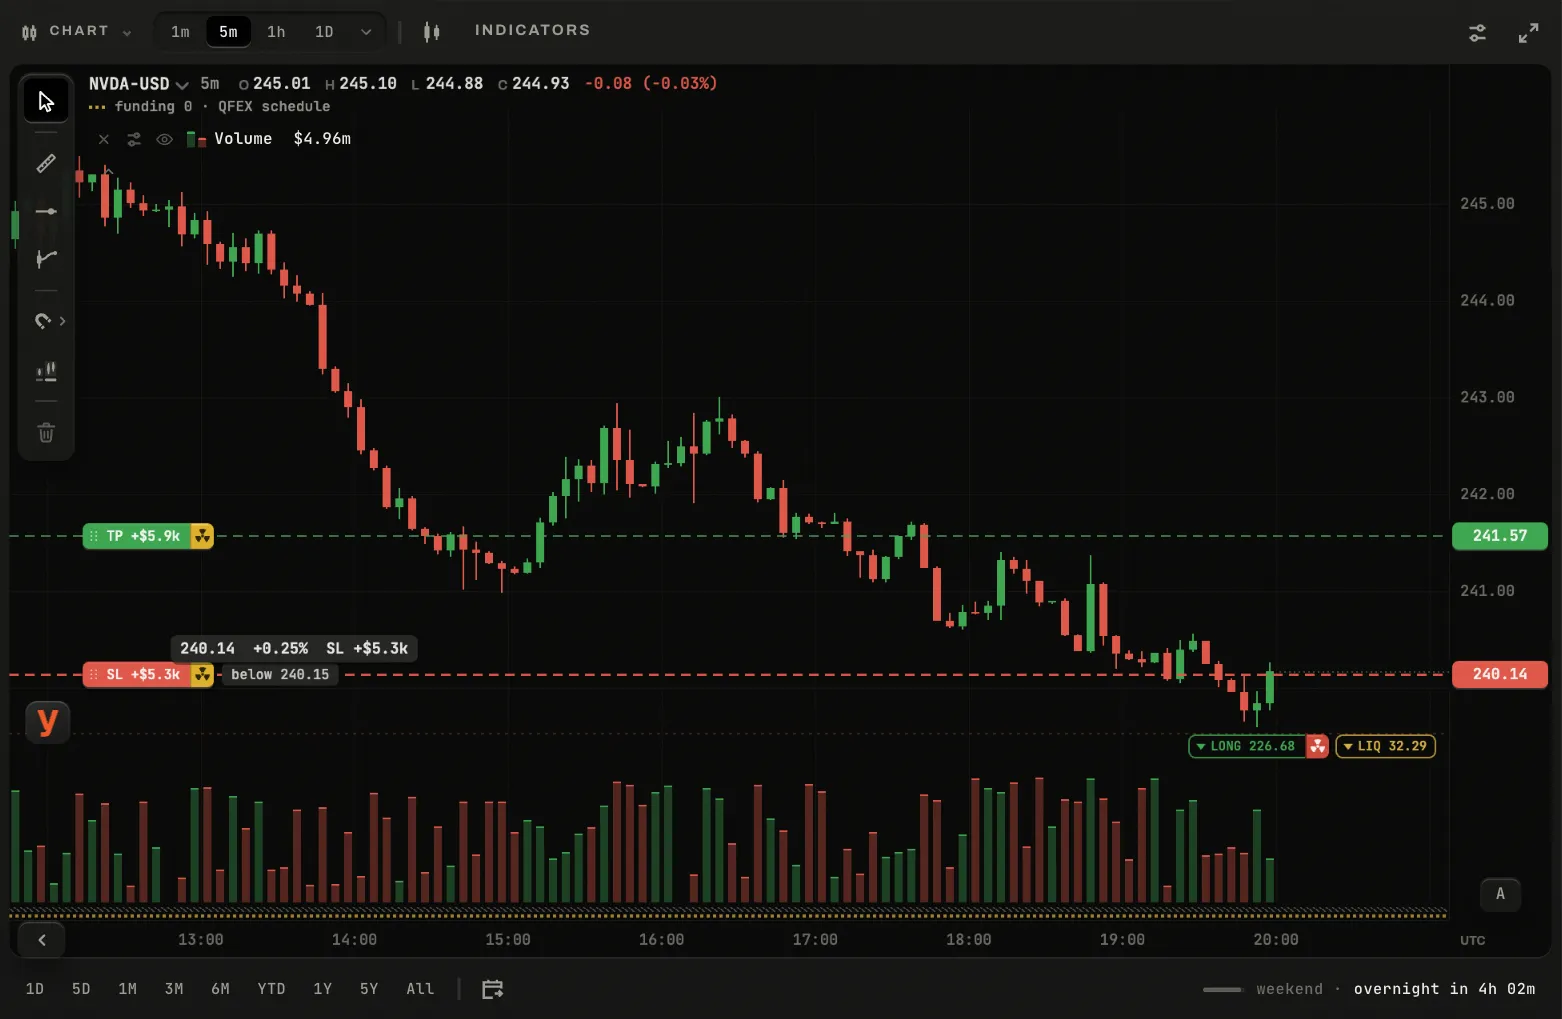
NVDA on the demo account: the stop-loss carried up through the mark stops at the last price it may take, and the chip beside its tag says why. Let go there, nothing is sent.
A dropped line holds where you dropped it until the account answers; if nothing answers it eases back to where the order really is, so the chart never shows an order somewhere it is not. A take-profit or stop-loss is checked against the account's rule all the while it is carried, so a level that would fire at once is never sent. Drags and cancels need no arm: a working order is not a new one.
The chart's settings switch the entry, the take-profit and stop-loss, the orders and the fills; liquidation is a locked always. Privacy hides every size and amount on the chart, never a price.