Features
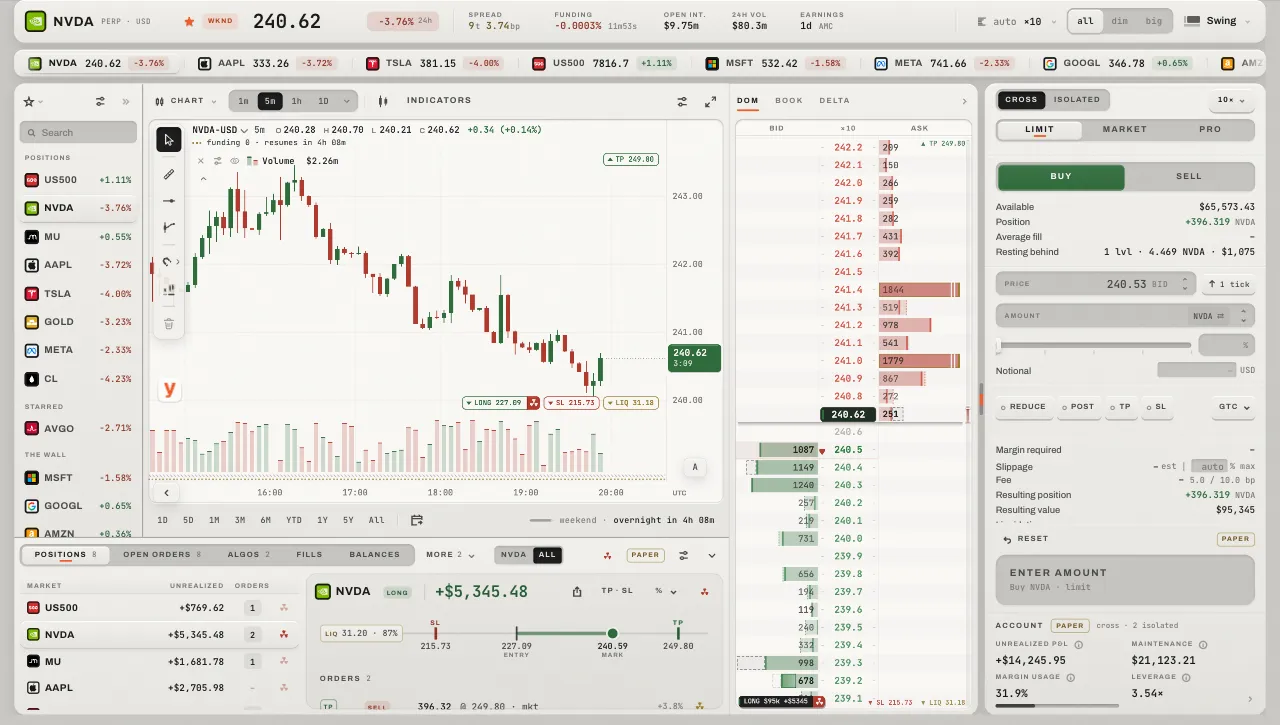
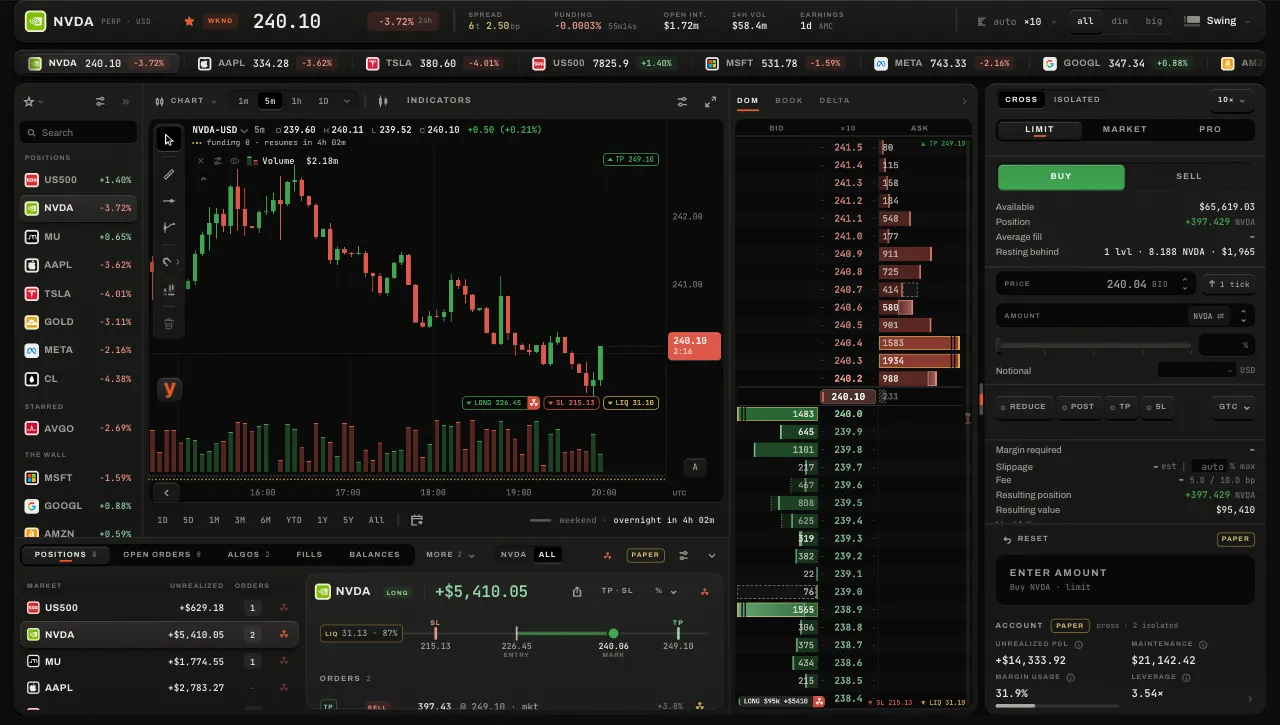
A trading terminal for QFEX, the 24/7 venue for perpetual futures on US stocks, indices, commodities and FX. Order flow read three ways, charts with years behind them, one-click and hotkey execution, a wall of sixteen markets, and every fill measured afterwards. Each feature is shown as it is, and a press away from its chapter.
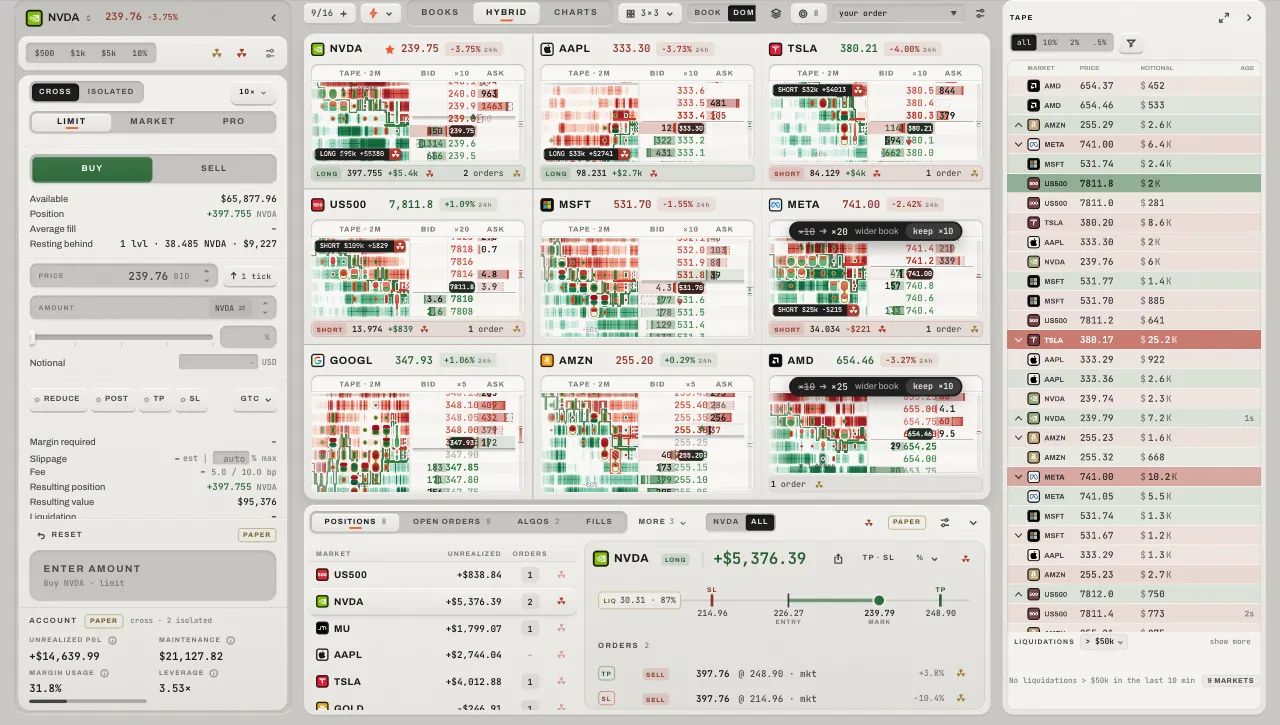
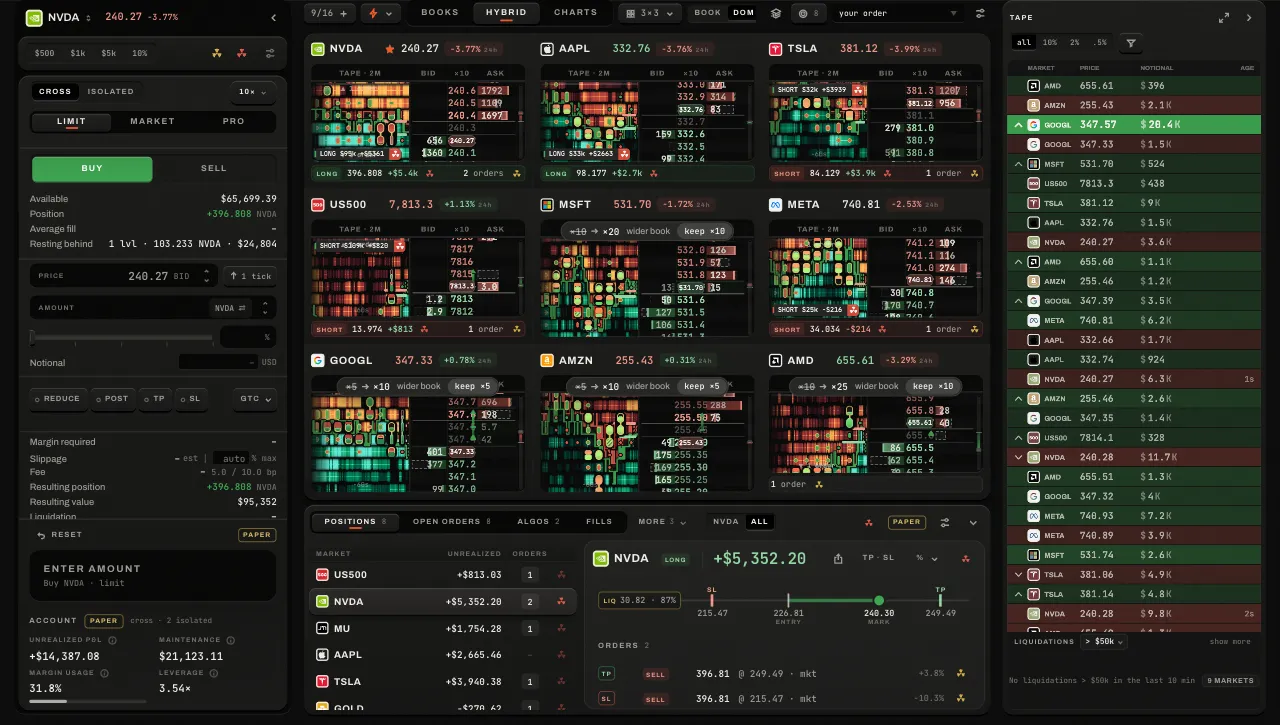
Liquidity heatmap
Every resting order at every price, through time: a band that runs on is size that stayed, and a band that ends with no print on it was pulled. Prints land where they traded.
DOM and depth of market
The price ladder beside its heat: sold, bid, price, ask, bought, delta and volume at every price. Pointing at a level sums what a market order would take to reach it.
Order book and queue position
Levels, not ticks: every price is a queue, and an order of yours shows where it stands and the size ahead of it. Walls, icebergs and pulled levels are marked.
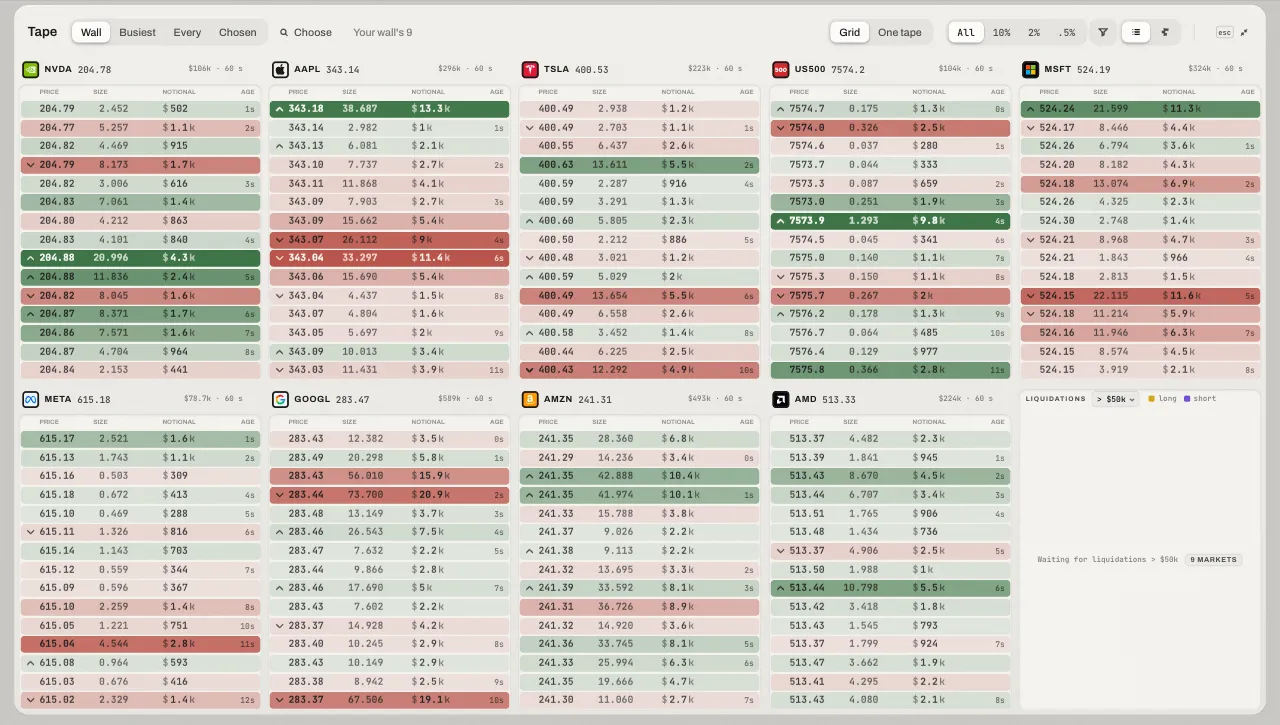
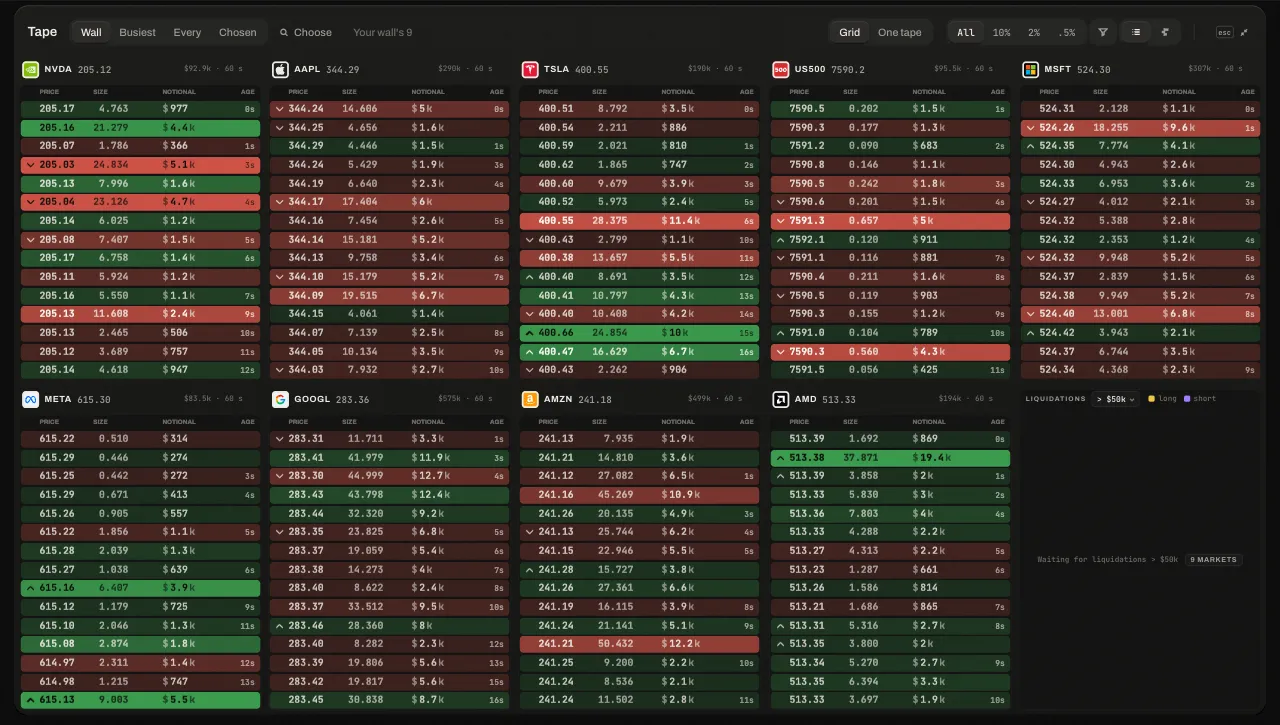
Time and sales
Every print is a row, coloured as strongly as it mattered in that market's own terms, so a large trade stands out on a quiet name and a busy one alike. Liquidations are marked, and a filter keeps only what matters.
Candlestick charts
One chart engine for every candle in the terminal, with years of daily history from before the market listed on QFEX, twenty-one timeframes, thirteen chart types, and each trading session in a hue of its own.
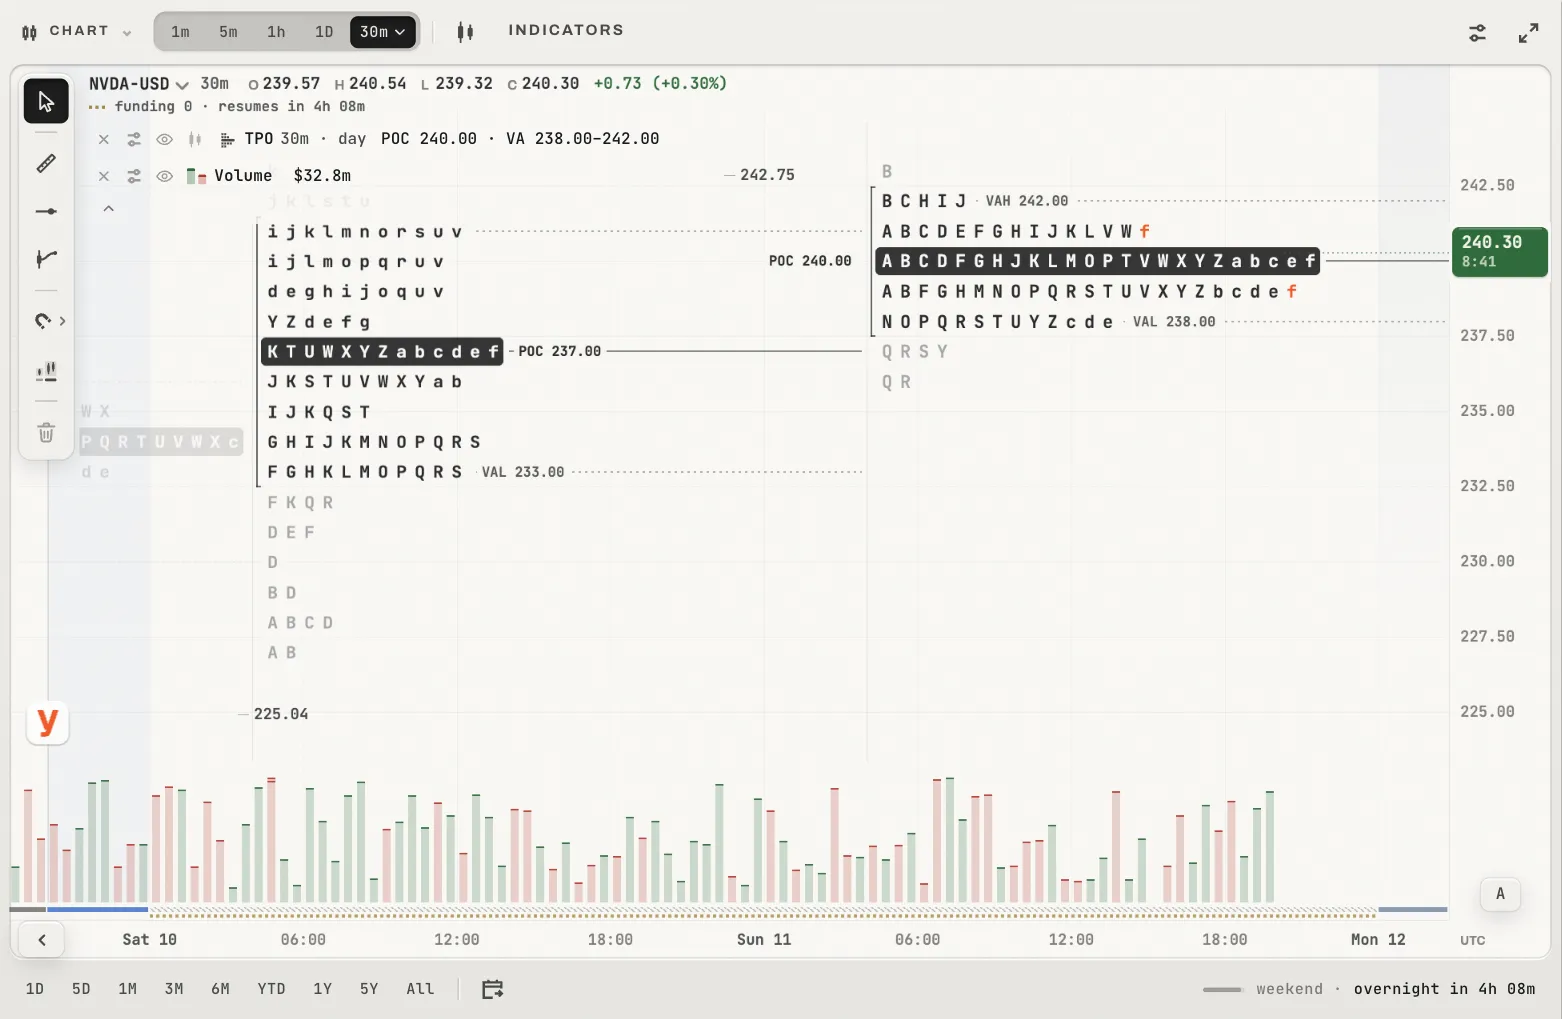
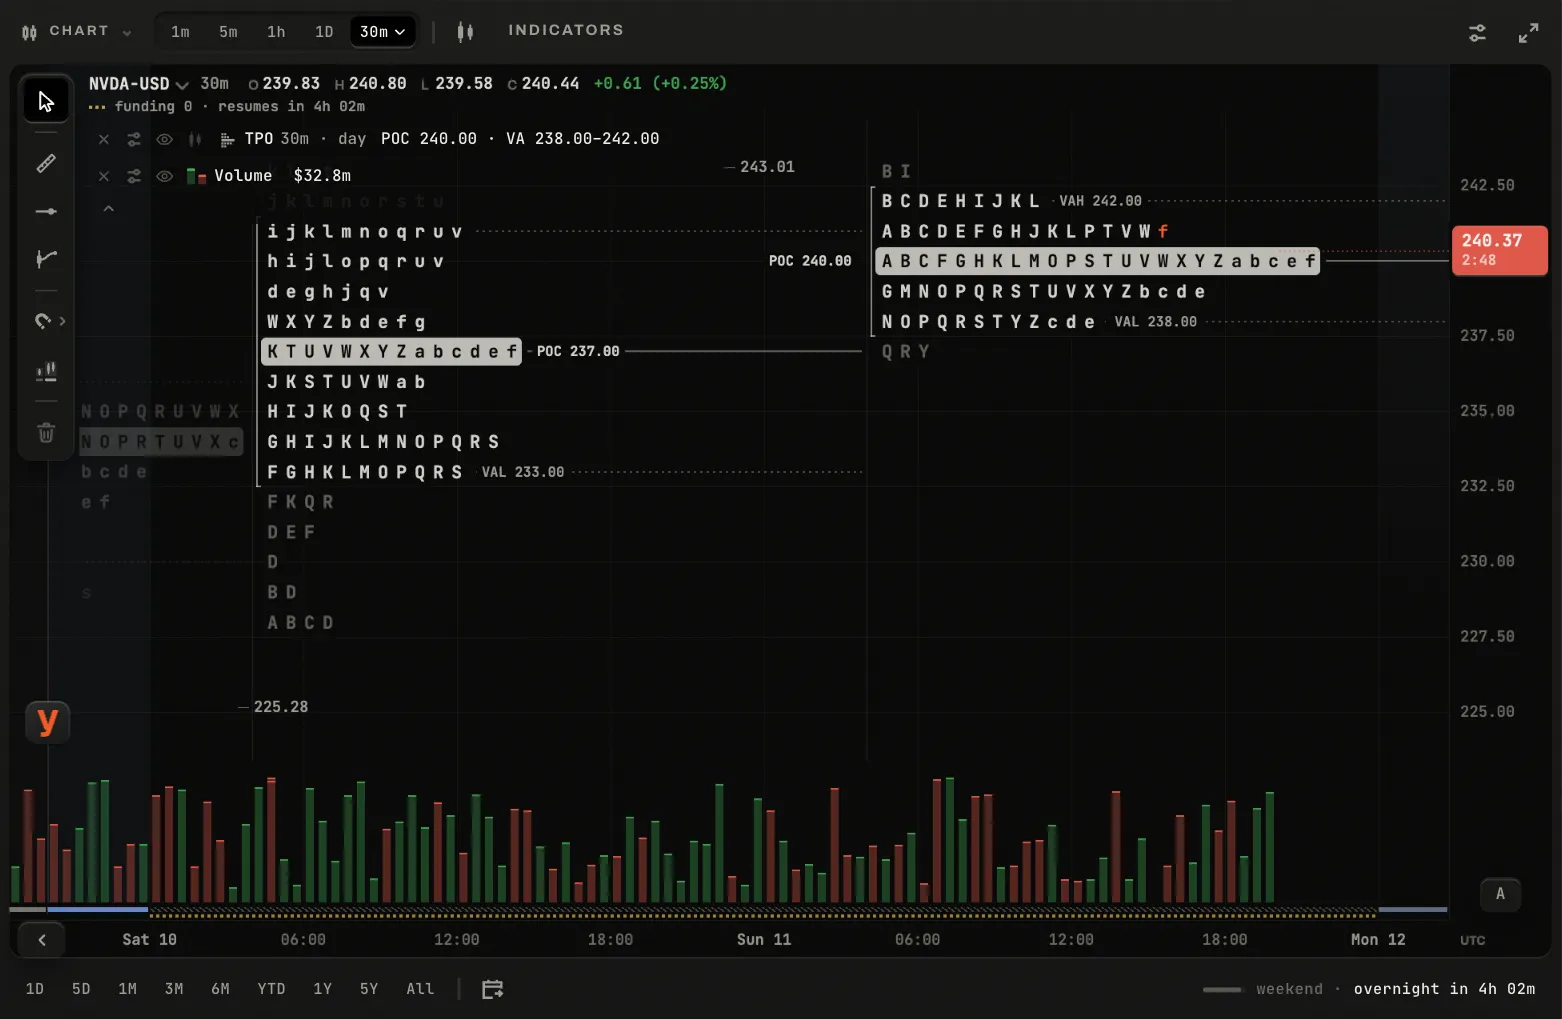
NVDA an hour a bar on the sample data.
Market profile (TPO)
The TPO, an indicator over any chart type: the time spent at each price, a letter for every half hour, with the value area and its point of control.
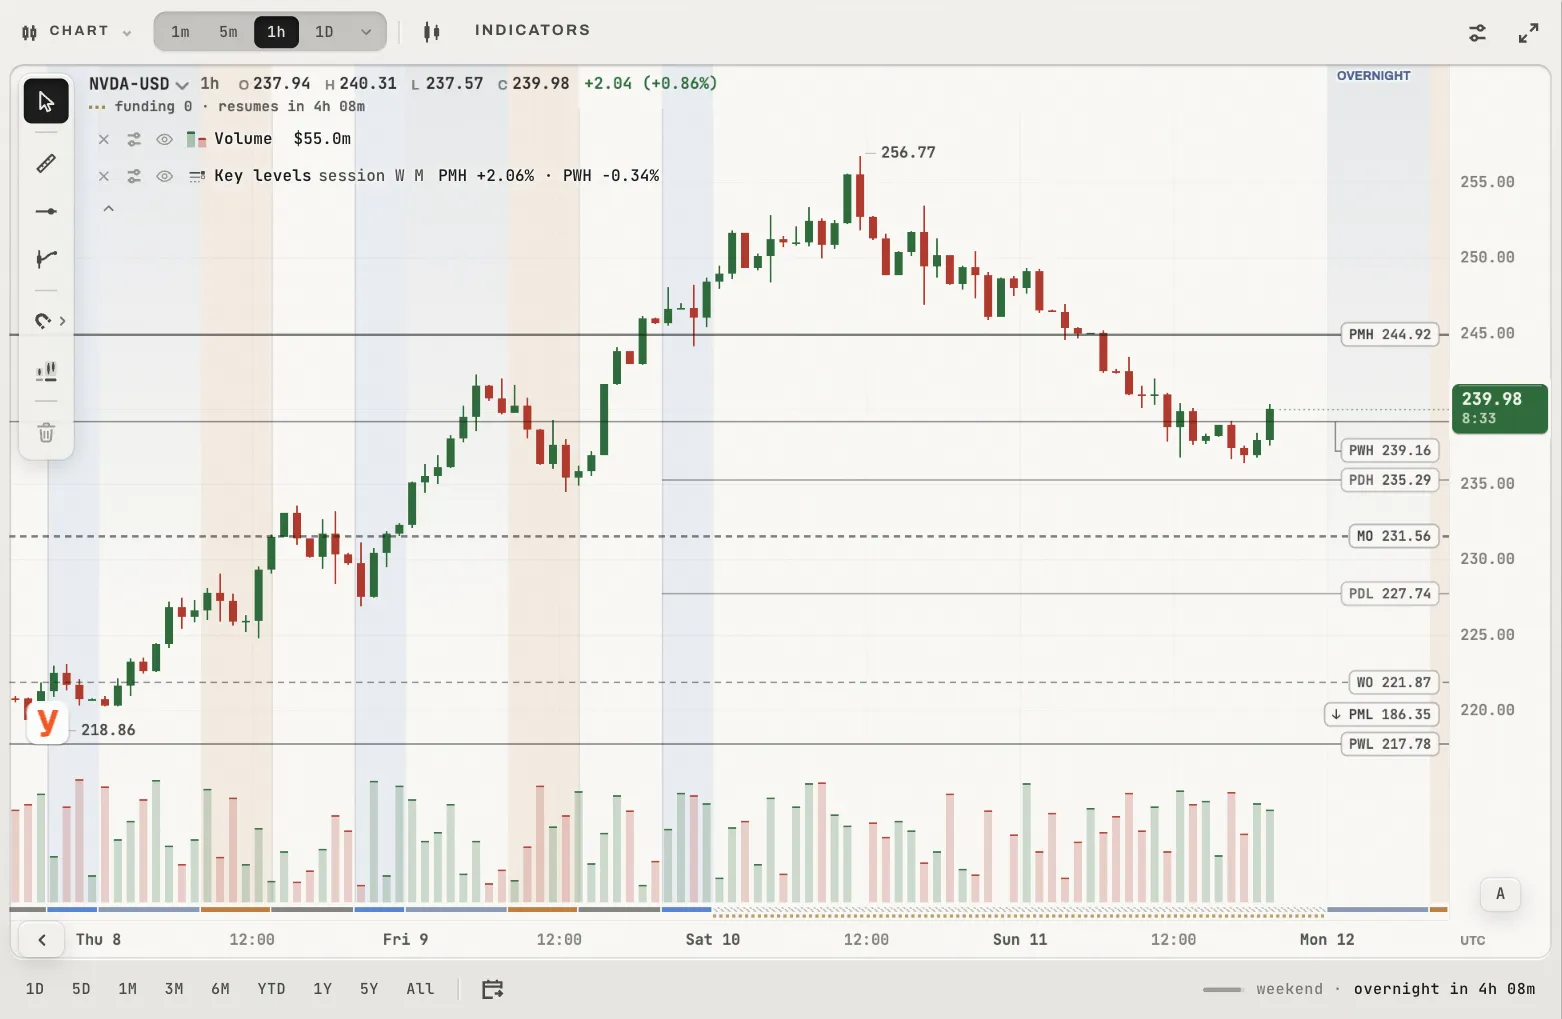
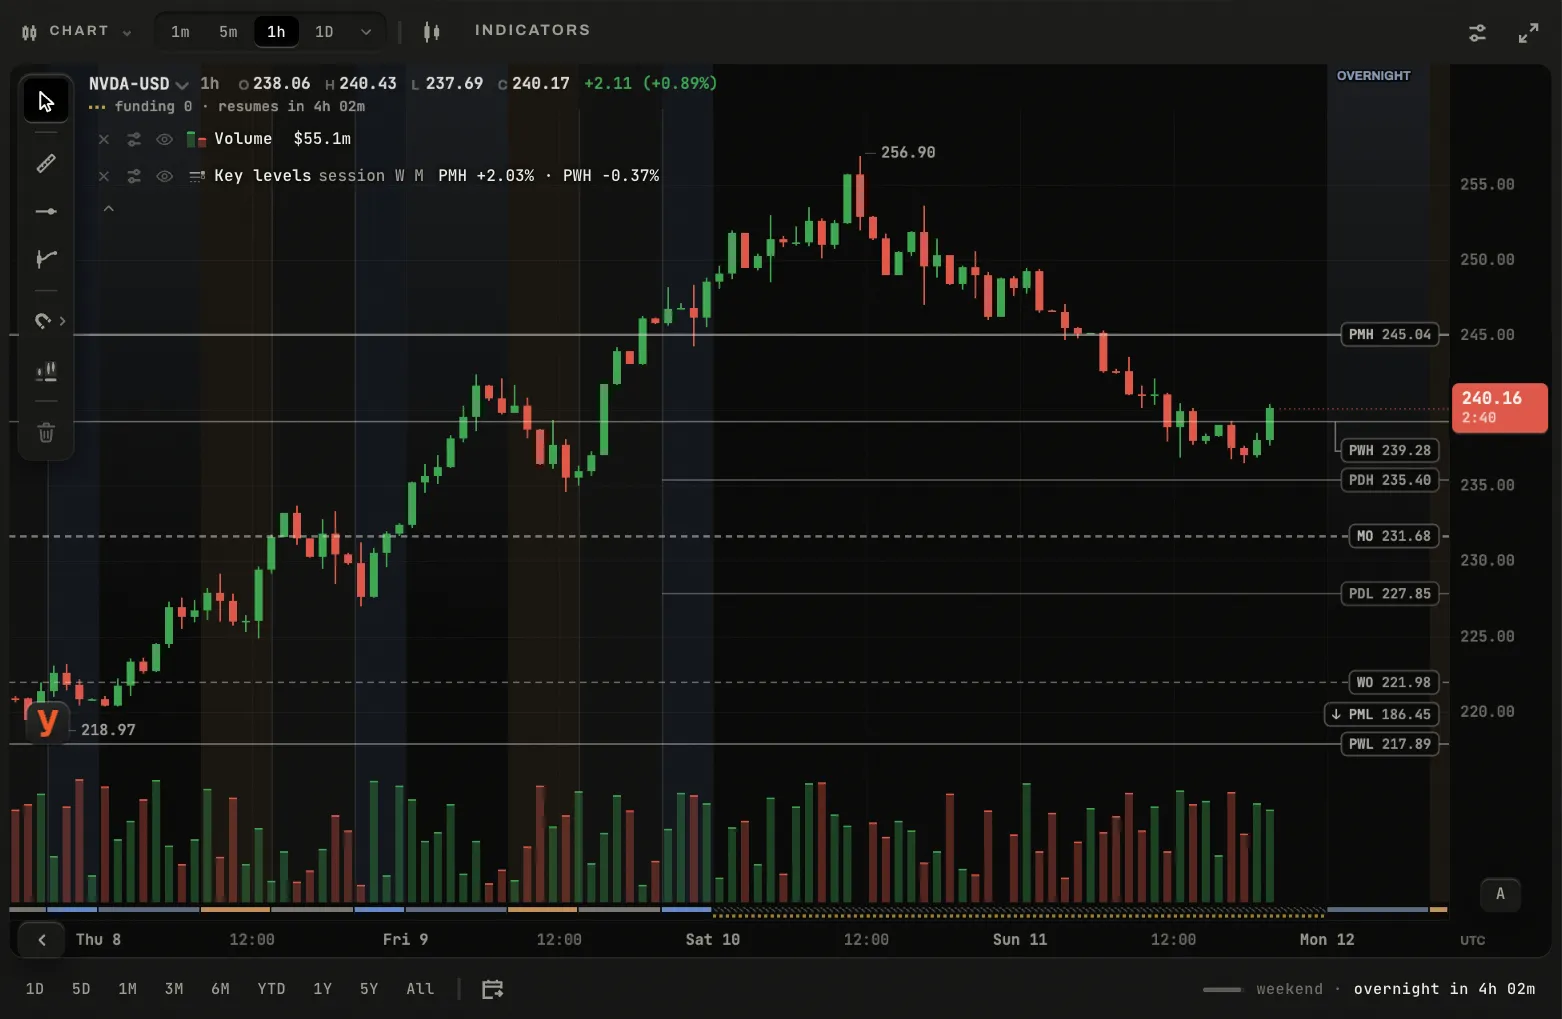
NVDA an hour a bar on the sample data.
Key levels
The last day's, week's and month's highs and lows and this period's open, cut on QFEX's own bars: a 24/7 book, and for a US name the day is its regular session.
Volume profile and VWAP
Profiles of the visible range, of each session and of any range you draw, with the session VWAP and its bands, anchored VWAP and EWMAs.
Take profit and stop loss on the chart
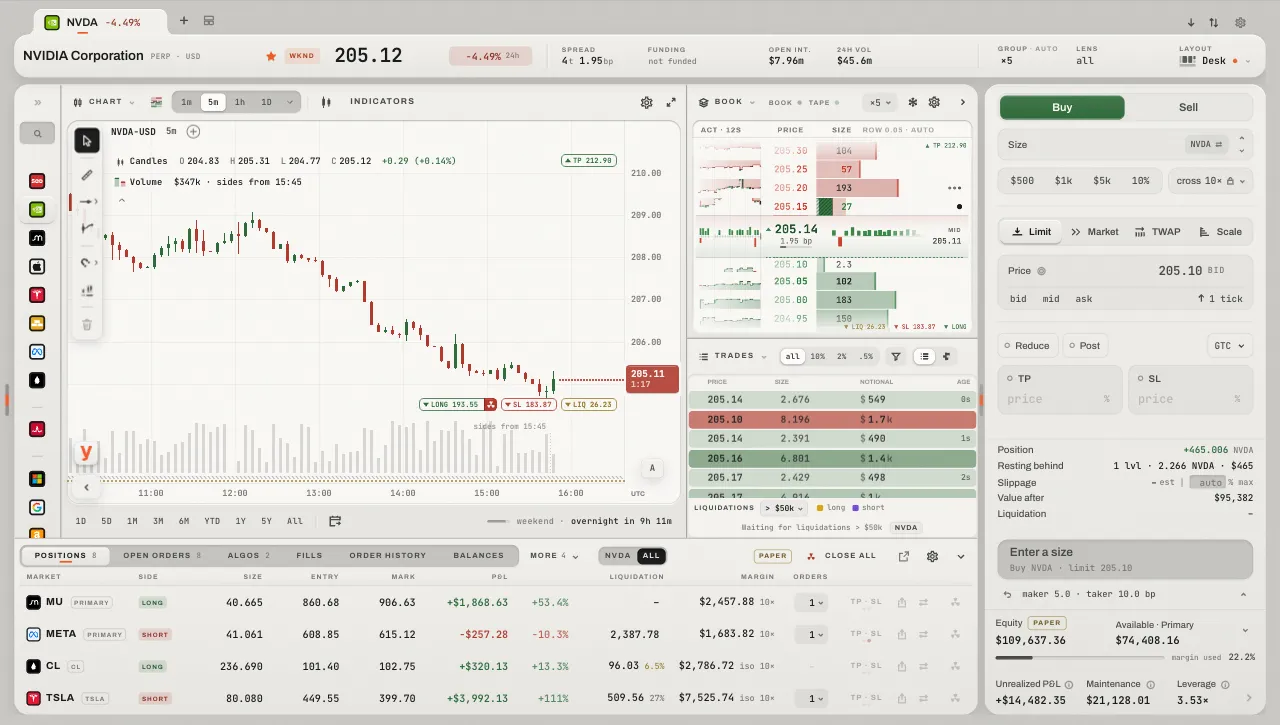
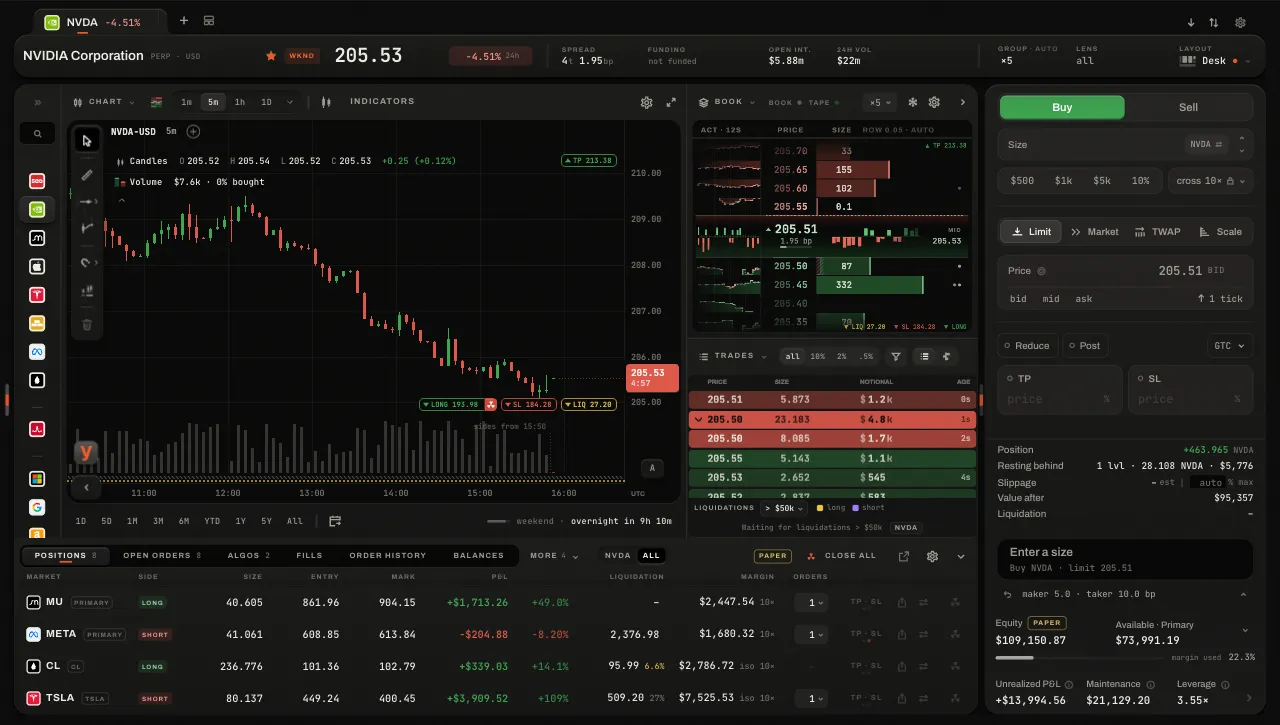
Your position, your orders, your take profit and your stop sit on the price as tags: drag one to move it, or drag a take profit or a stop out of the position's own tag. A stop is never sent where it would fire at once; it stops at the price and says why.
The calendar
QFEX's calendar: each QFEX name's report and each economy's release, on a page of its own and on the bars. A dot is an exact minute, a session one word, a dashed ring a day alone; a name's window runs from the last cash close before it to the first open after it, and an economy's figures read as published.
One-click trading
A click on any price, on the heatmap, the DOM or the book, fills the ticket with that price and side and says what it would do. On the chart, select the ticket's price first: a click then writes the price under the pointer into it. Hold ARM and the same click places the order; a press on the lit ARM makes every surface safe.
Hotkeys
One key an act, the same on Focus and on the wall: side, kind, size, send, take profit, stop and flatten. Every key can be rebound.
TWAP, iceberg, scale and chase
Beyond limit and market: stop and stop limit, scale (up to fifty limits between two prices), TWAP (slices over a minute to four hours), chase (a limit pegged to the touch) and iceberg (a share of its size shown at a time). Reduce only and post only mean exactly that.
Margin and liquidation price
The ticket reads the book it would meet as you type: what it would fill at, what it costs with the fee, the margin it takes and where it would leave your liquidation.
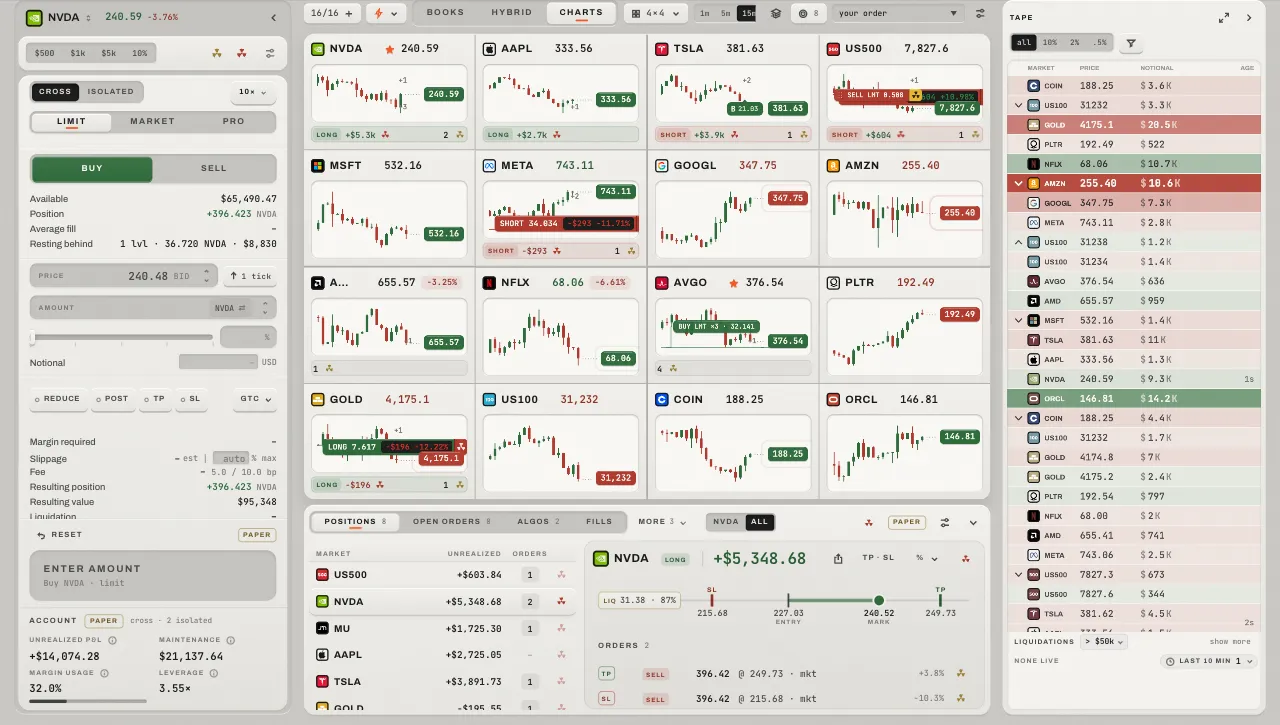
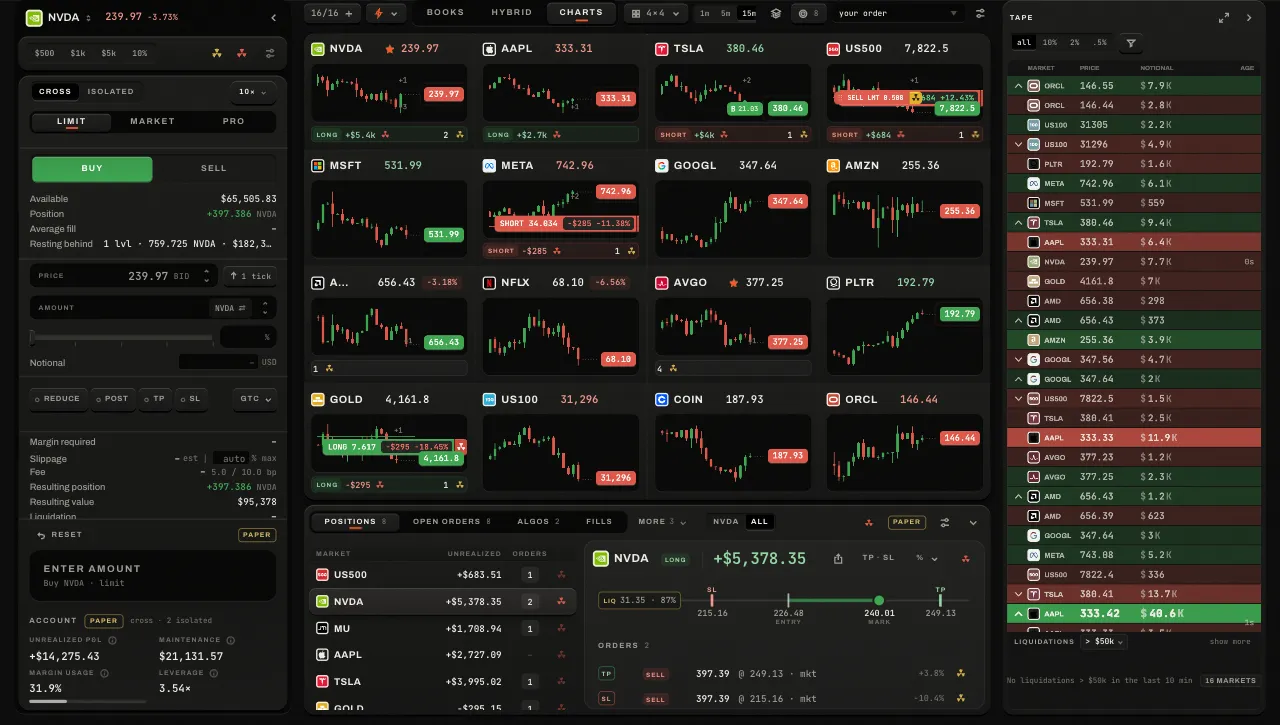
Sixteen markets as charts on the sample data; every card can be a book or a heat plate instead.
A wall of sixteen markets
Up to sixteen markets on one grid you cut yourself, each card an order book, a heat plate or a chart. A preset deals a whole wall in one press.
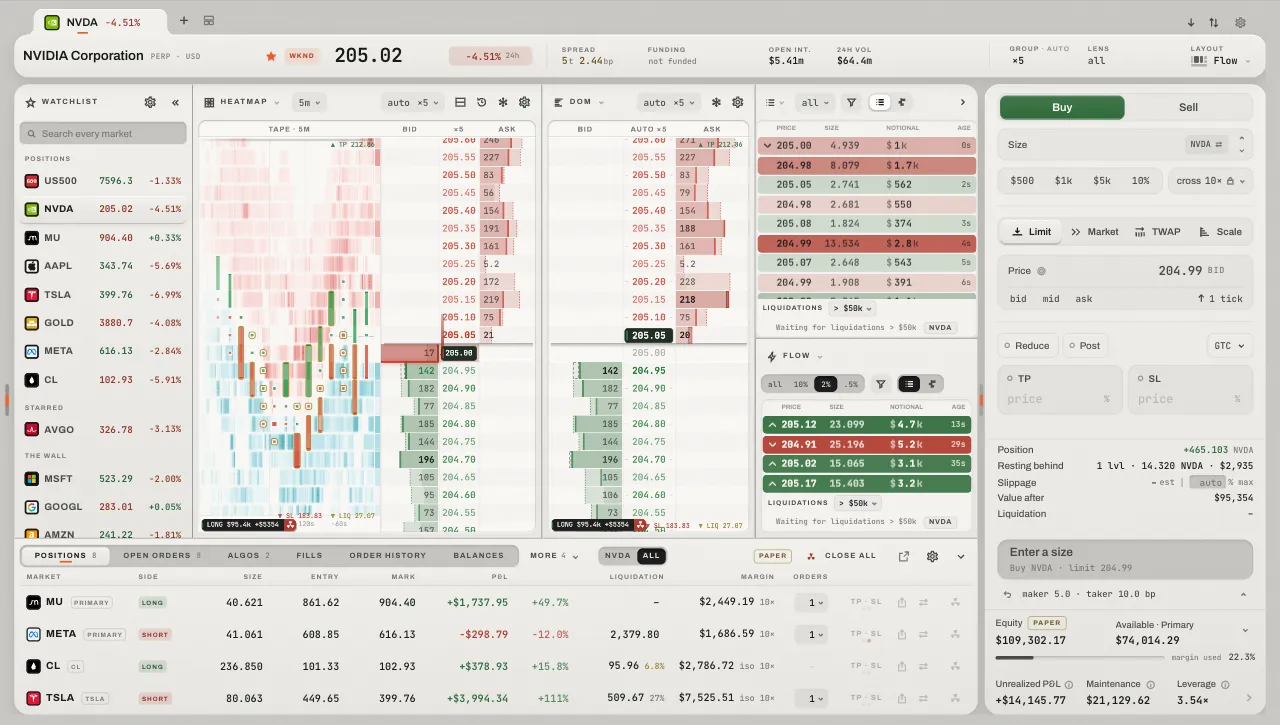
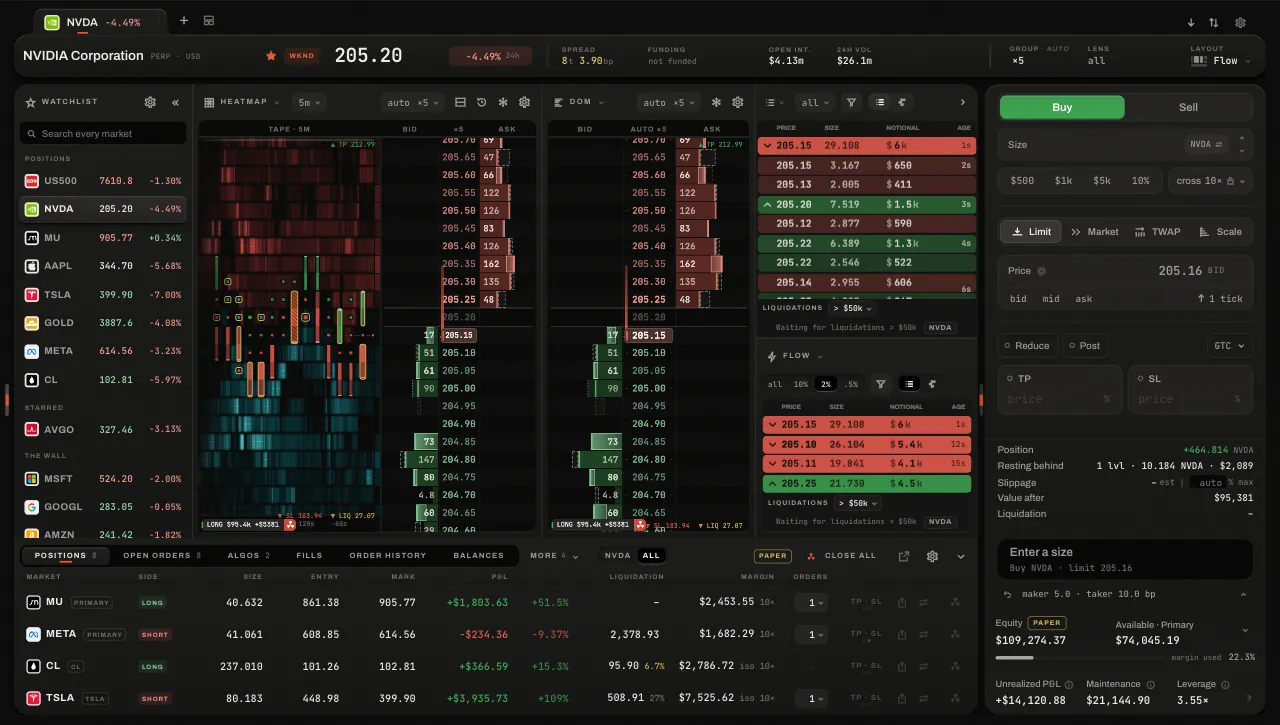
Flow: the heat and the DOM, with the tape beside them.
Layouts
Focus comes in five layouts, from a chart with its book to the heat and the tape.
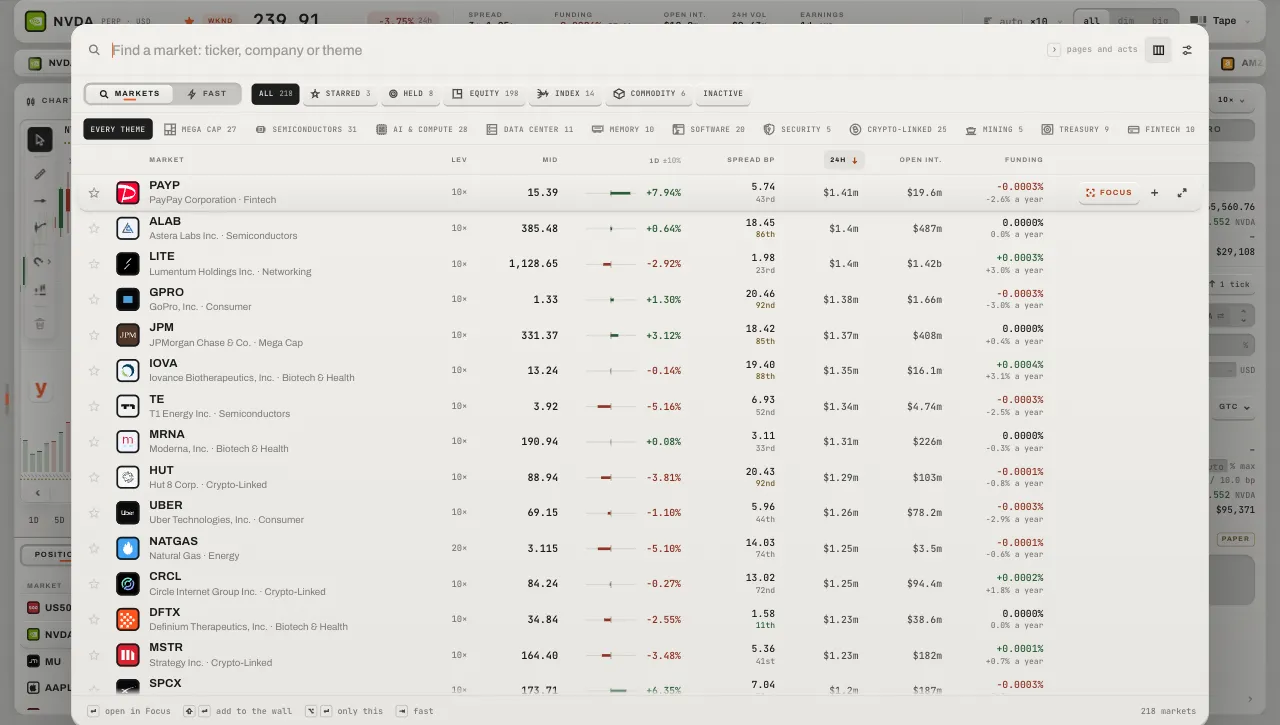
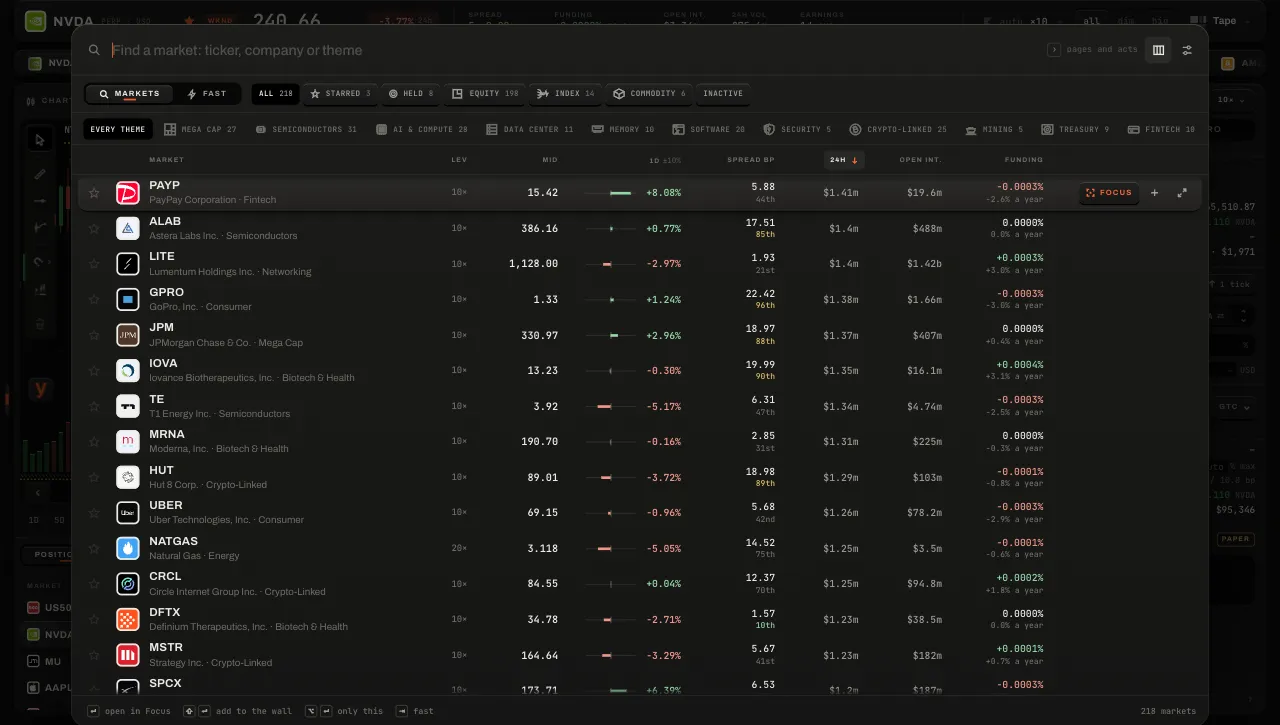
The finder's table on the sample data.
Market scanner
Every market QFEX lists in one table, ranked by the day's volume, the day's move, the spread, funding or open interest. Every row opens in Focus or joins the wall.
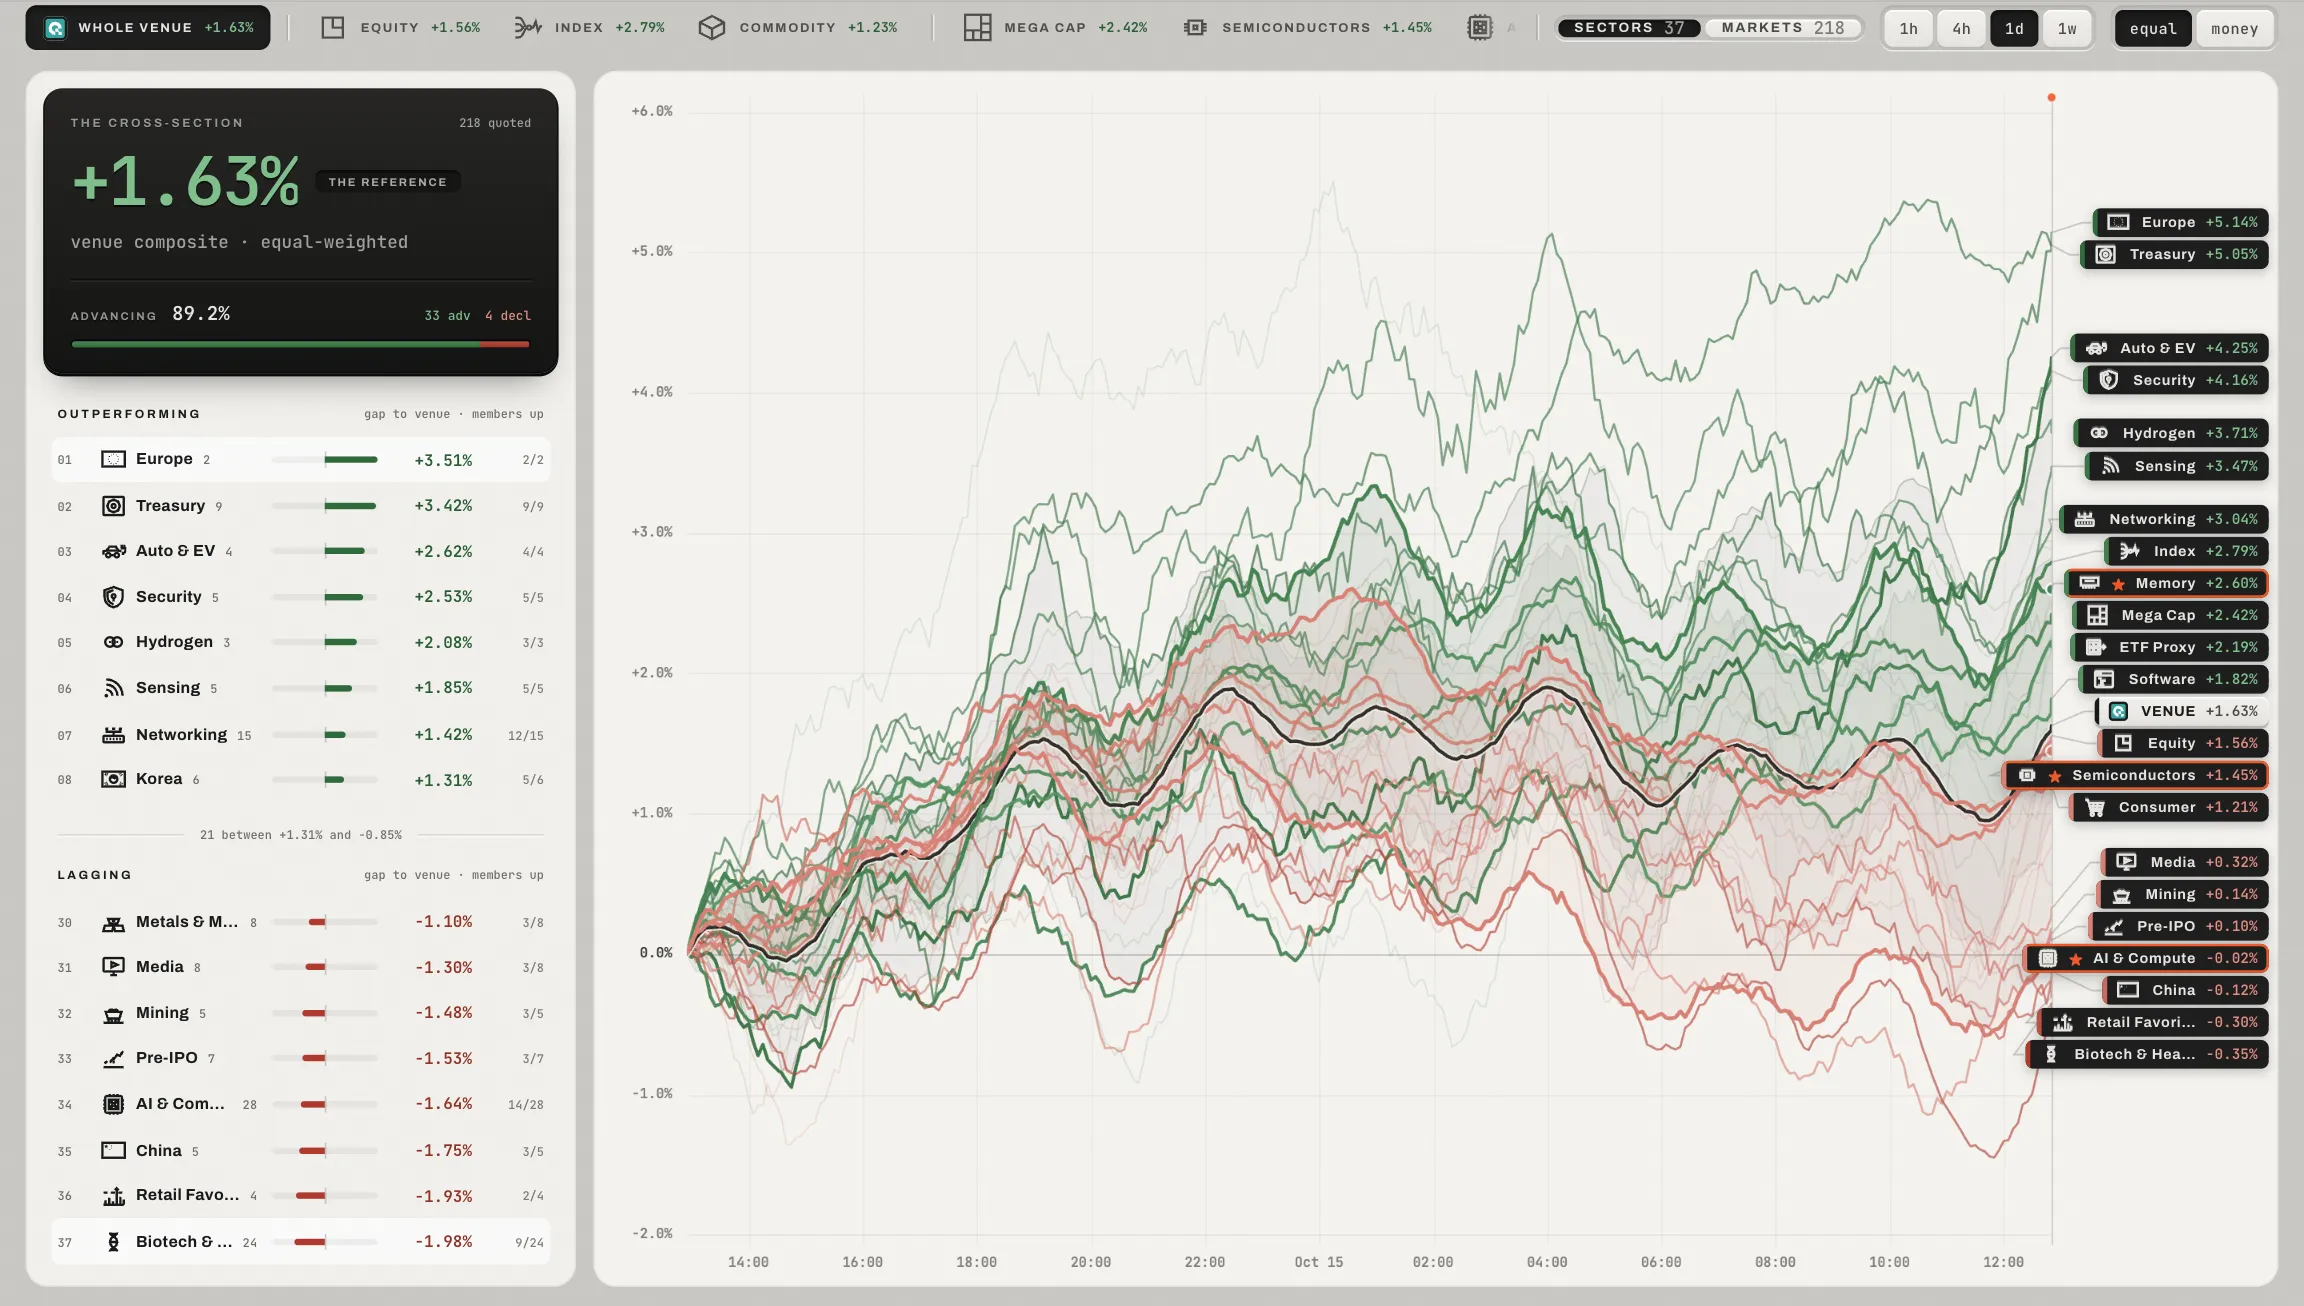
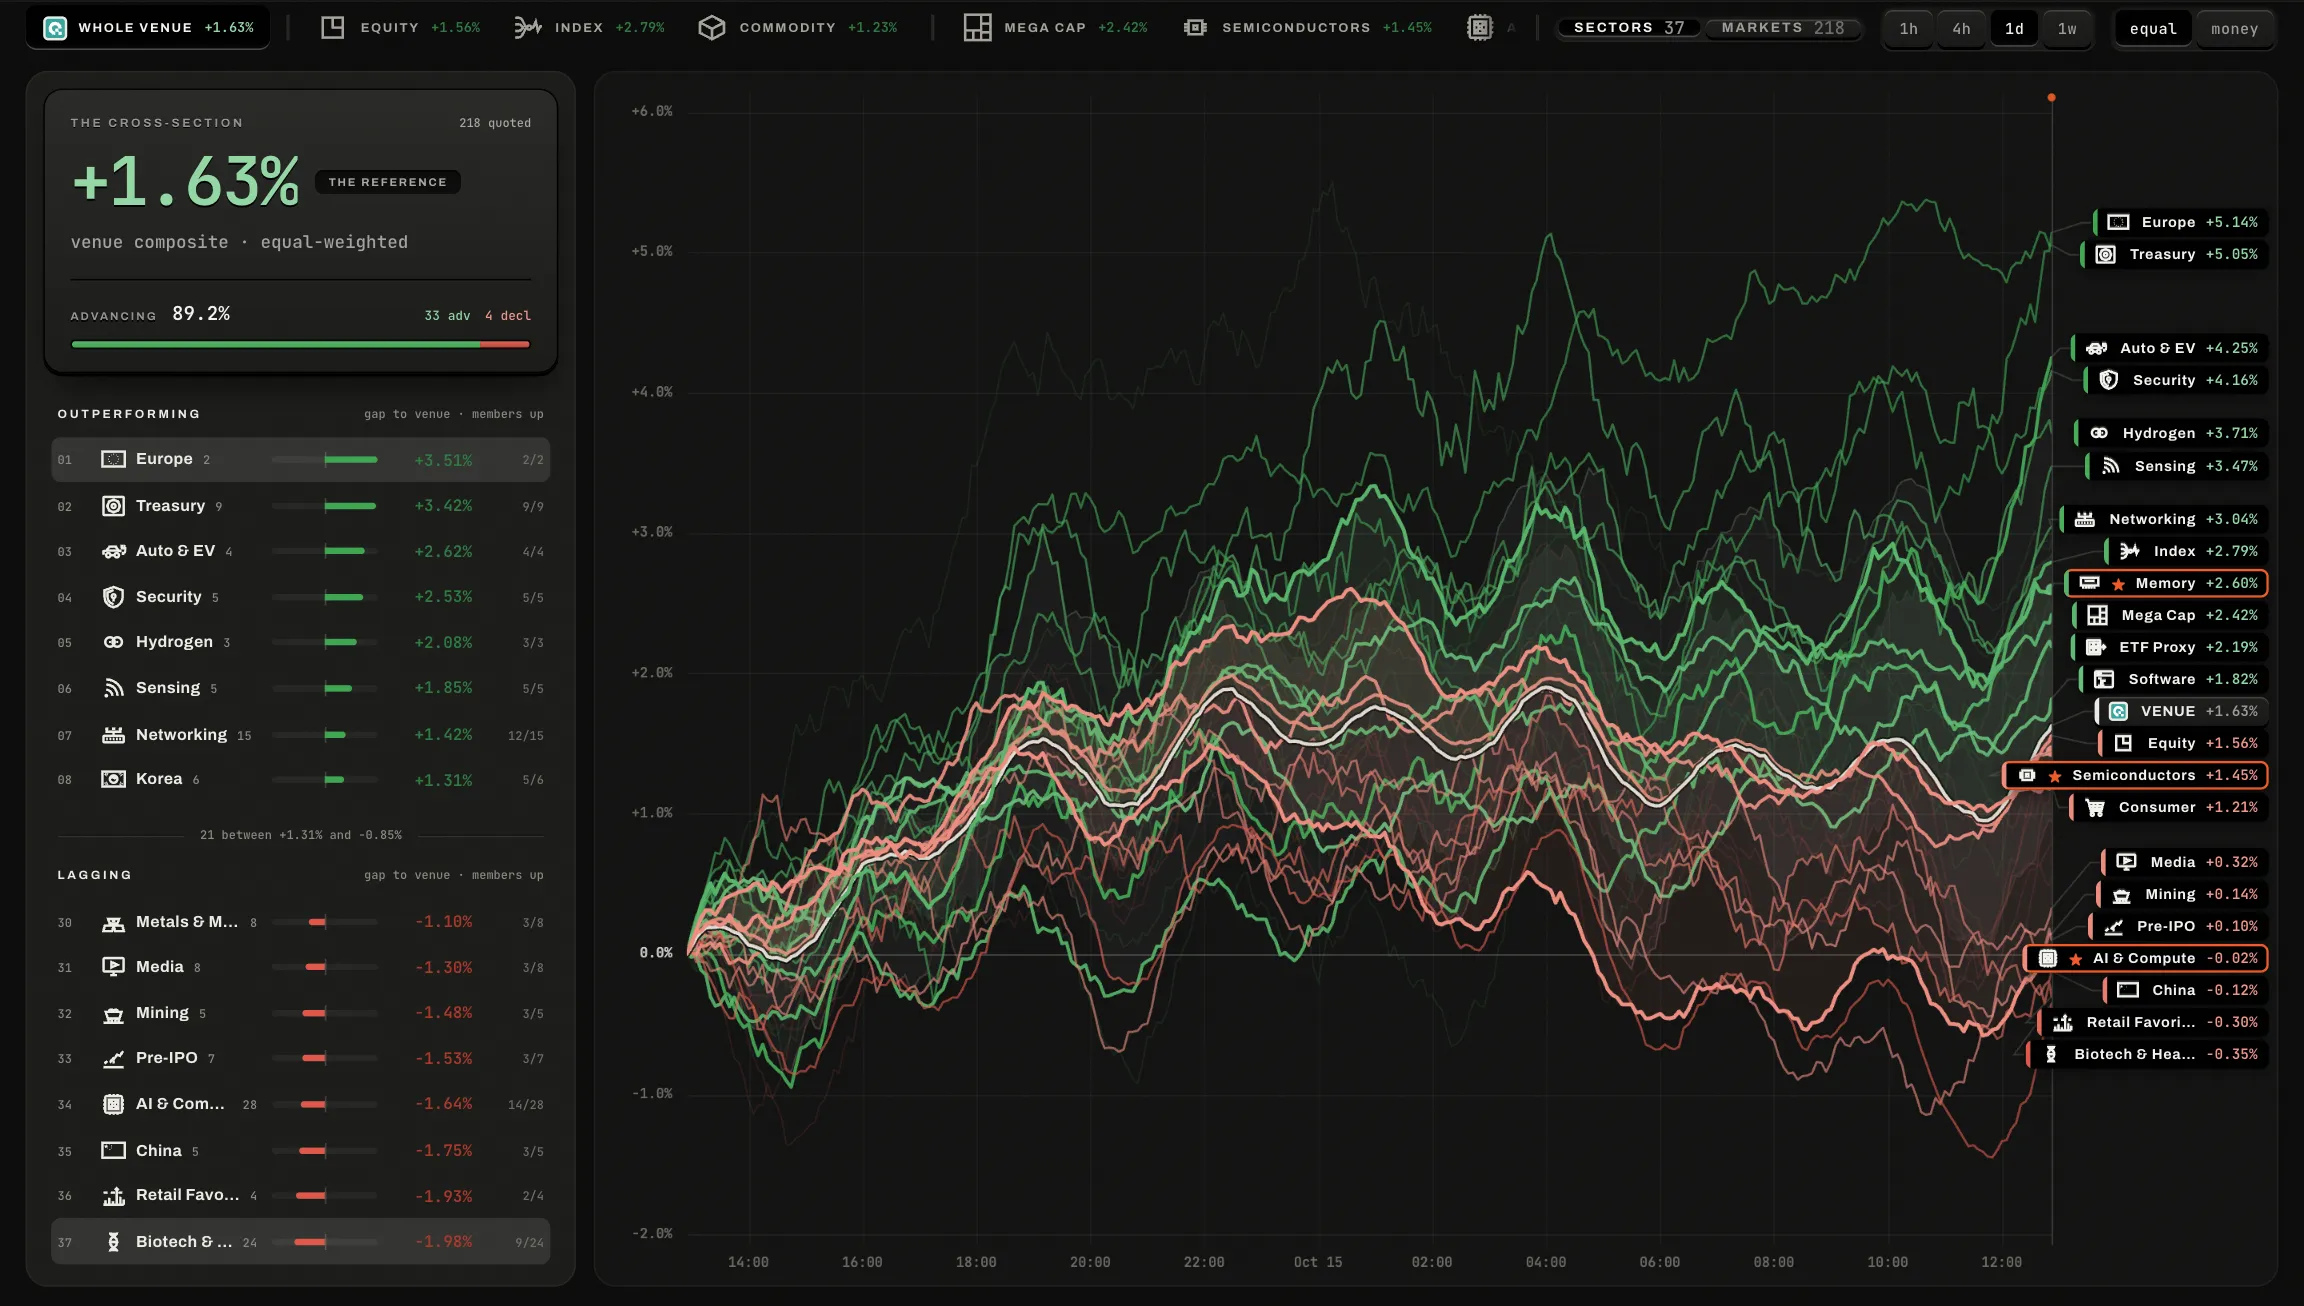
Every market from one zero against the venue's composite, on the sample data.
Relative strength
Every market from the same zero, against a composite of all of them: who leads, who lags, and the one leaving the crowd.
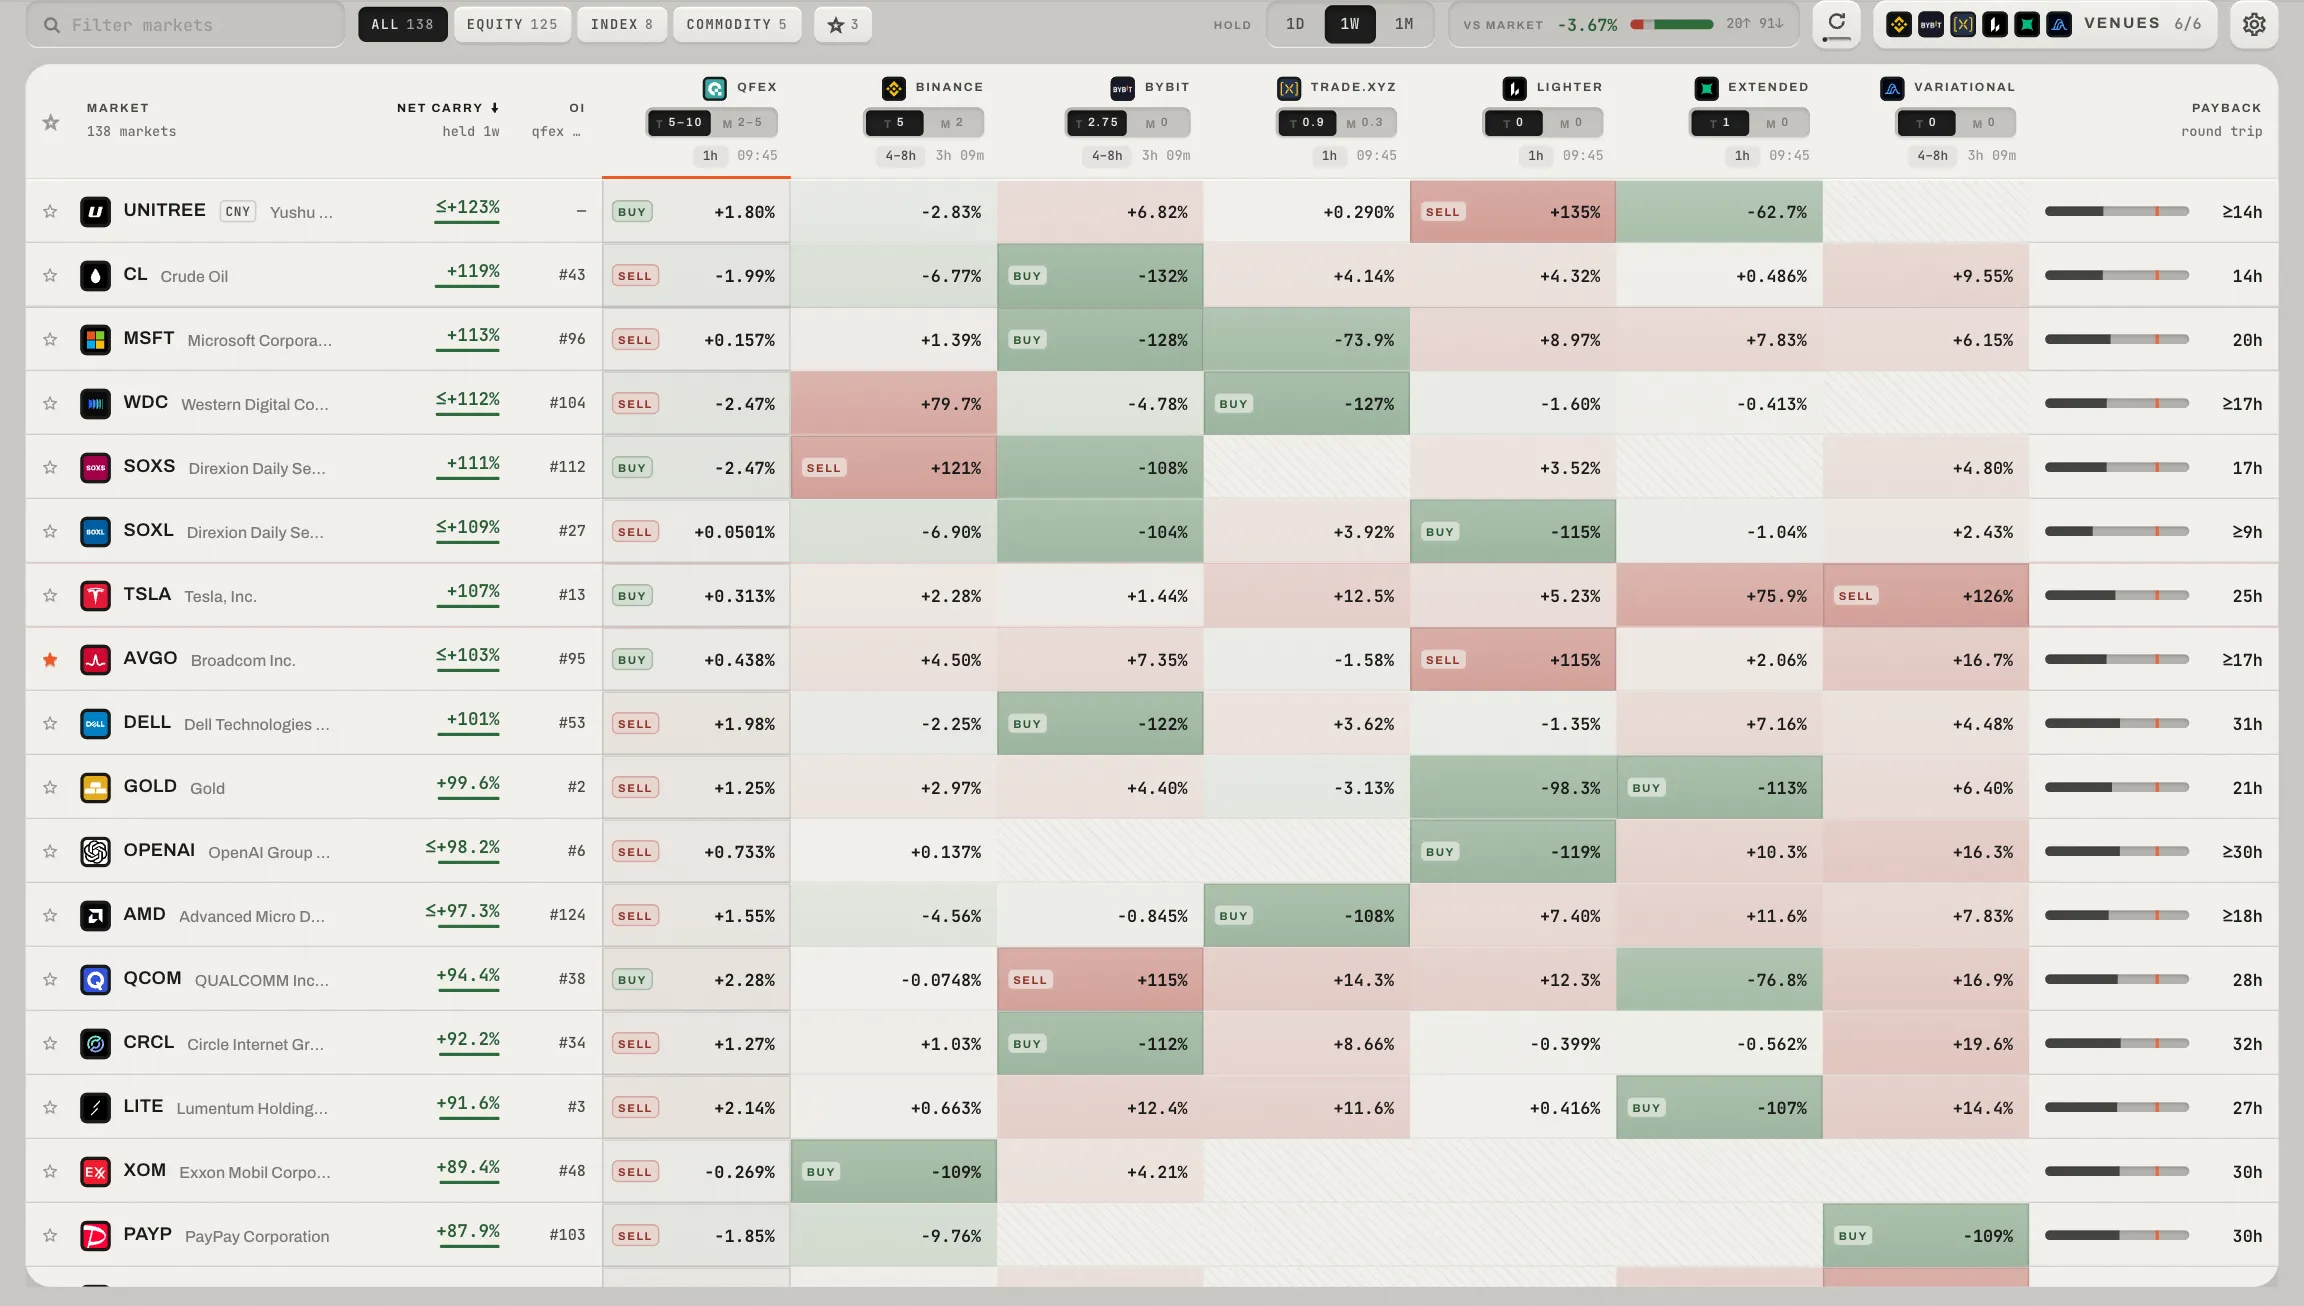
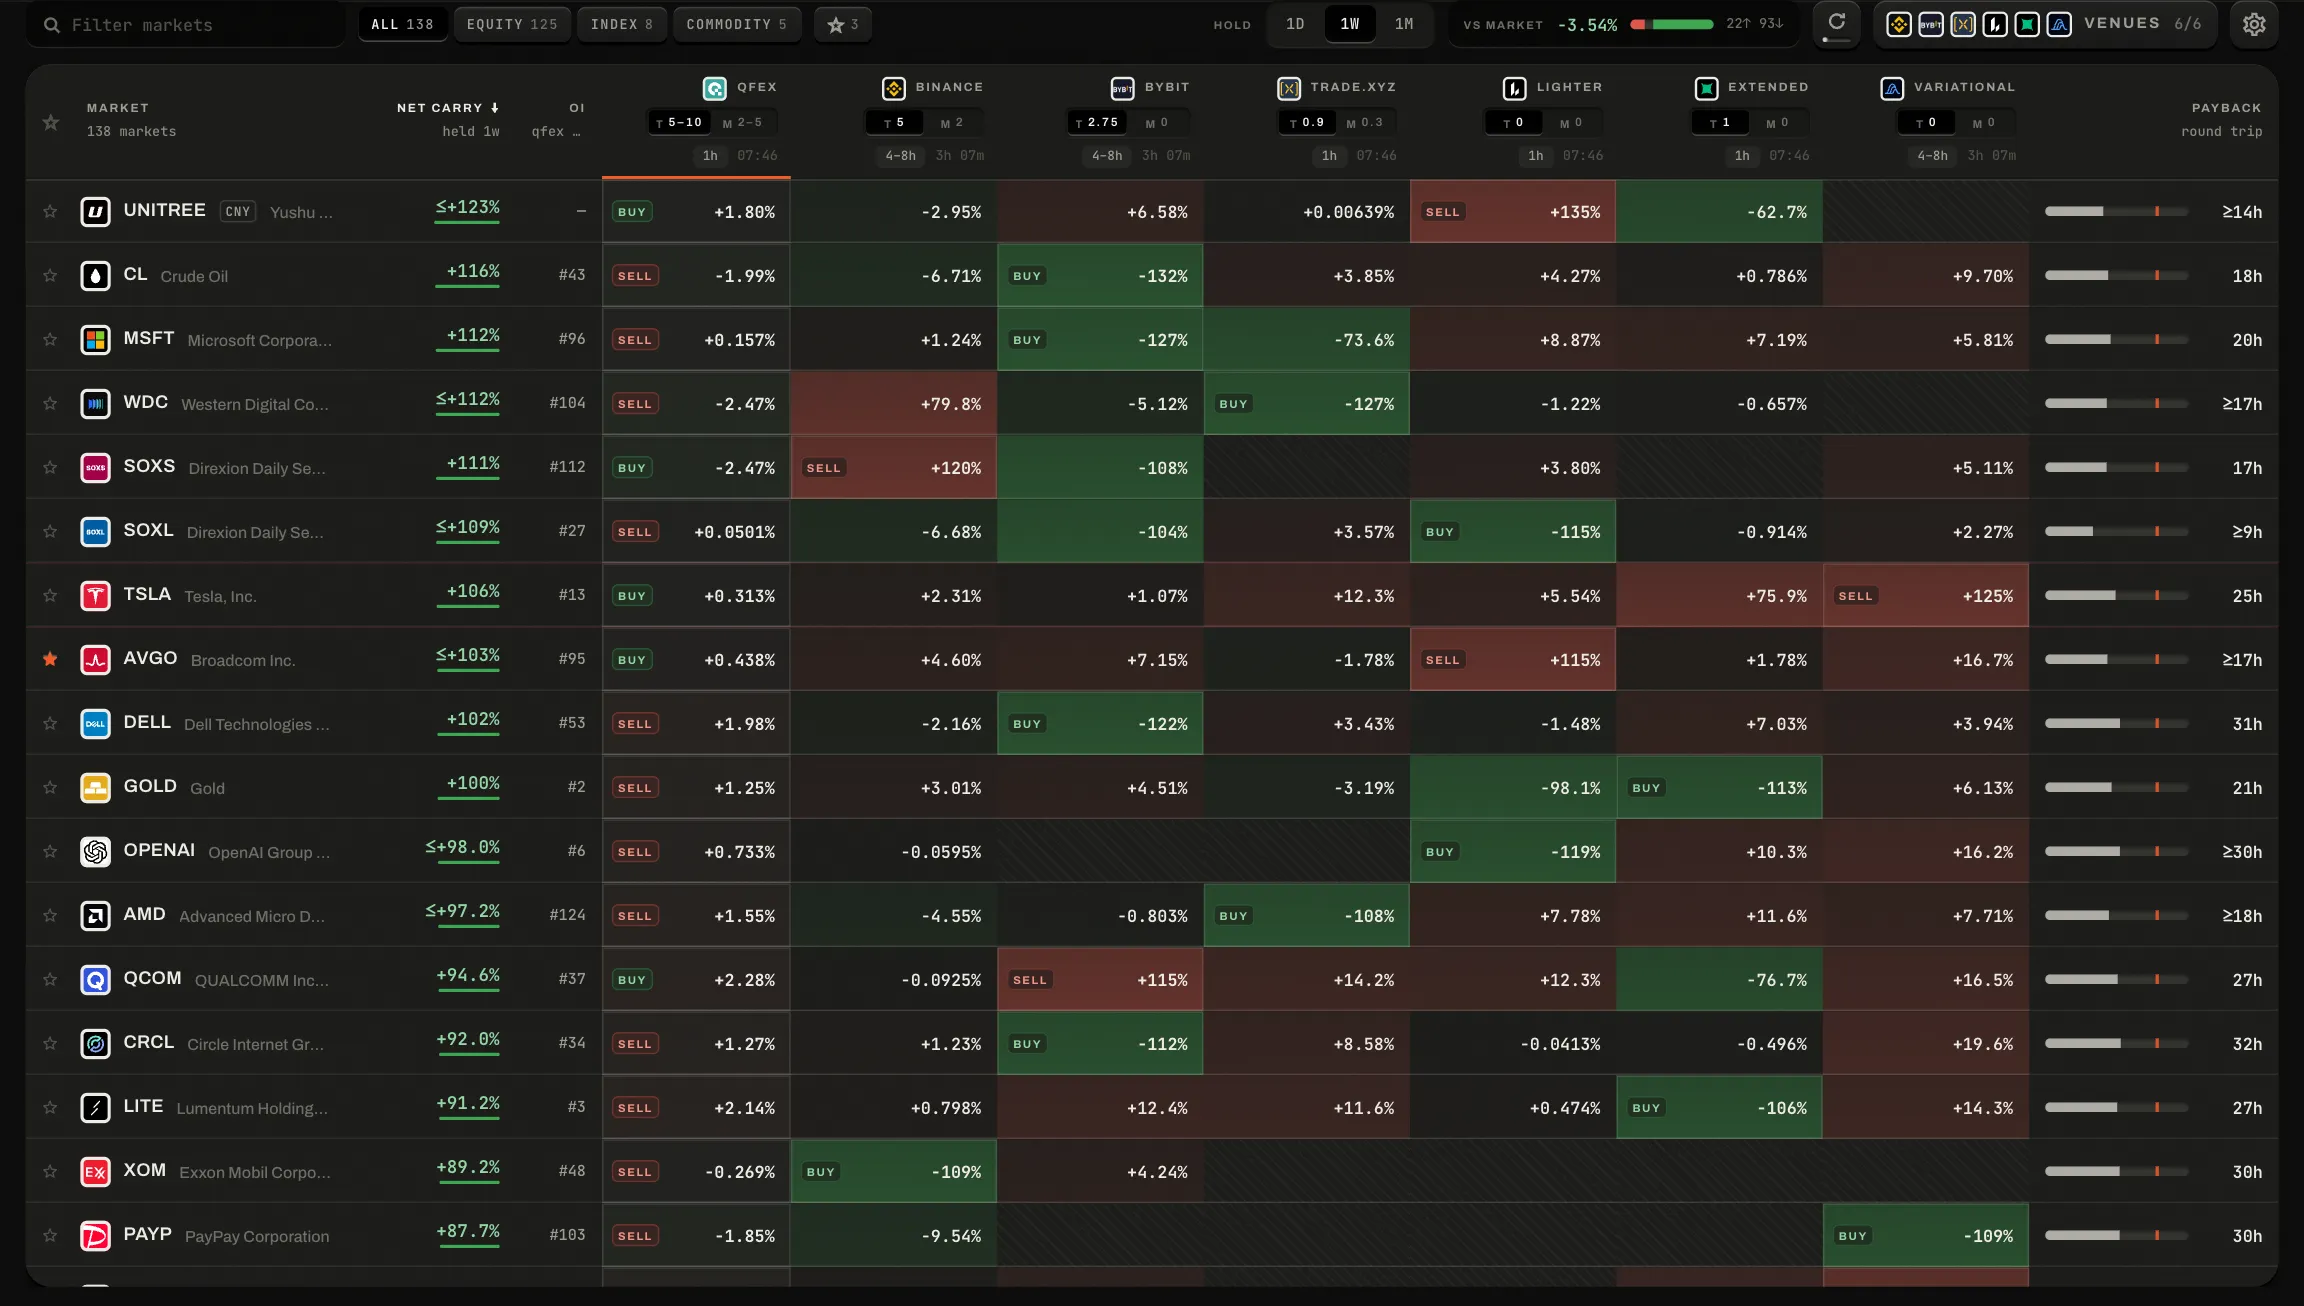
QFEX's rate beside the rest of the market's, on the sample data.
Funding rate comparison
QFEX's funding beside the rest of the market's for the same underlyings, and the pair that would collect the gap: what it keeps after both legs' fees and spreads over a day, a week or a month.
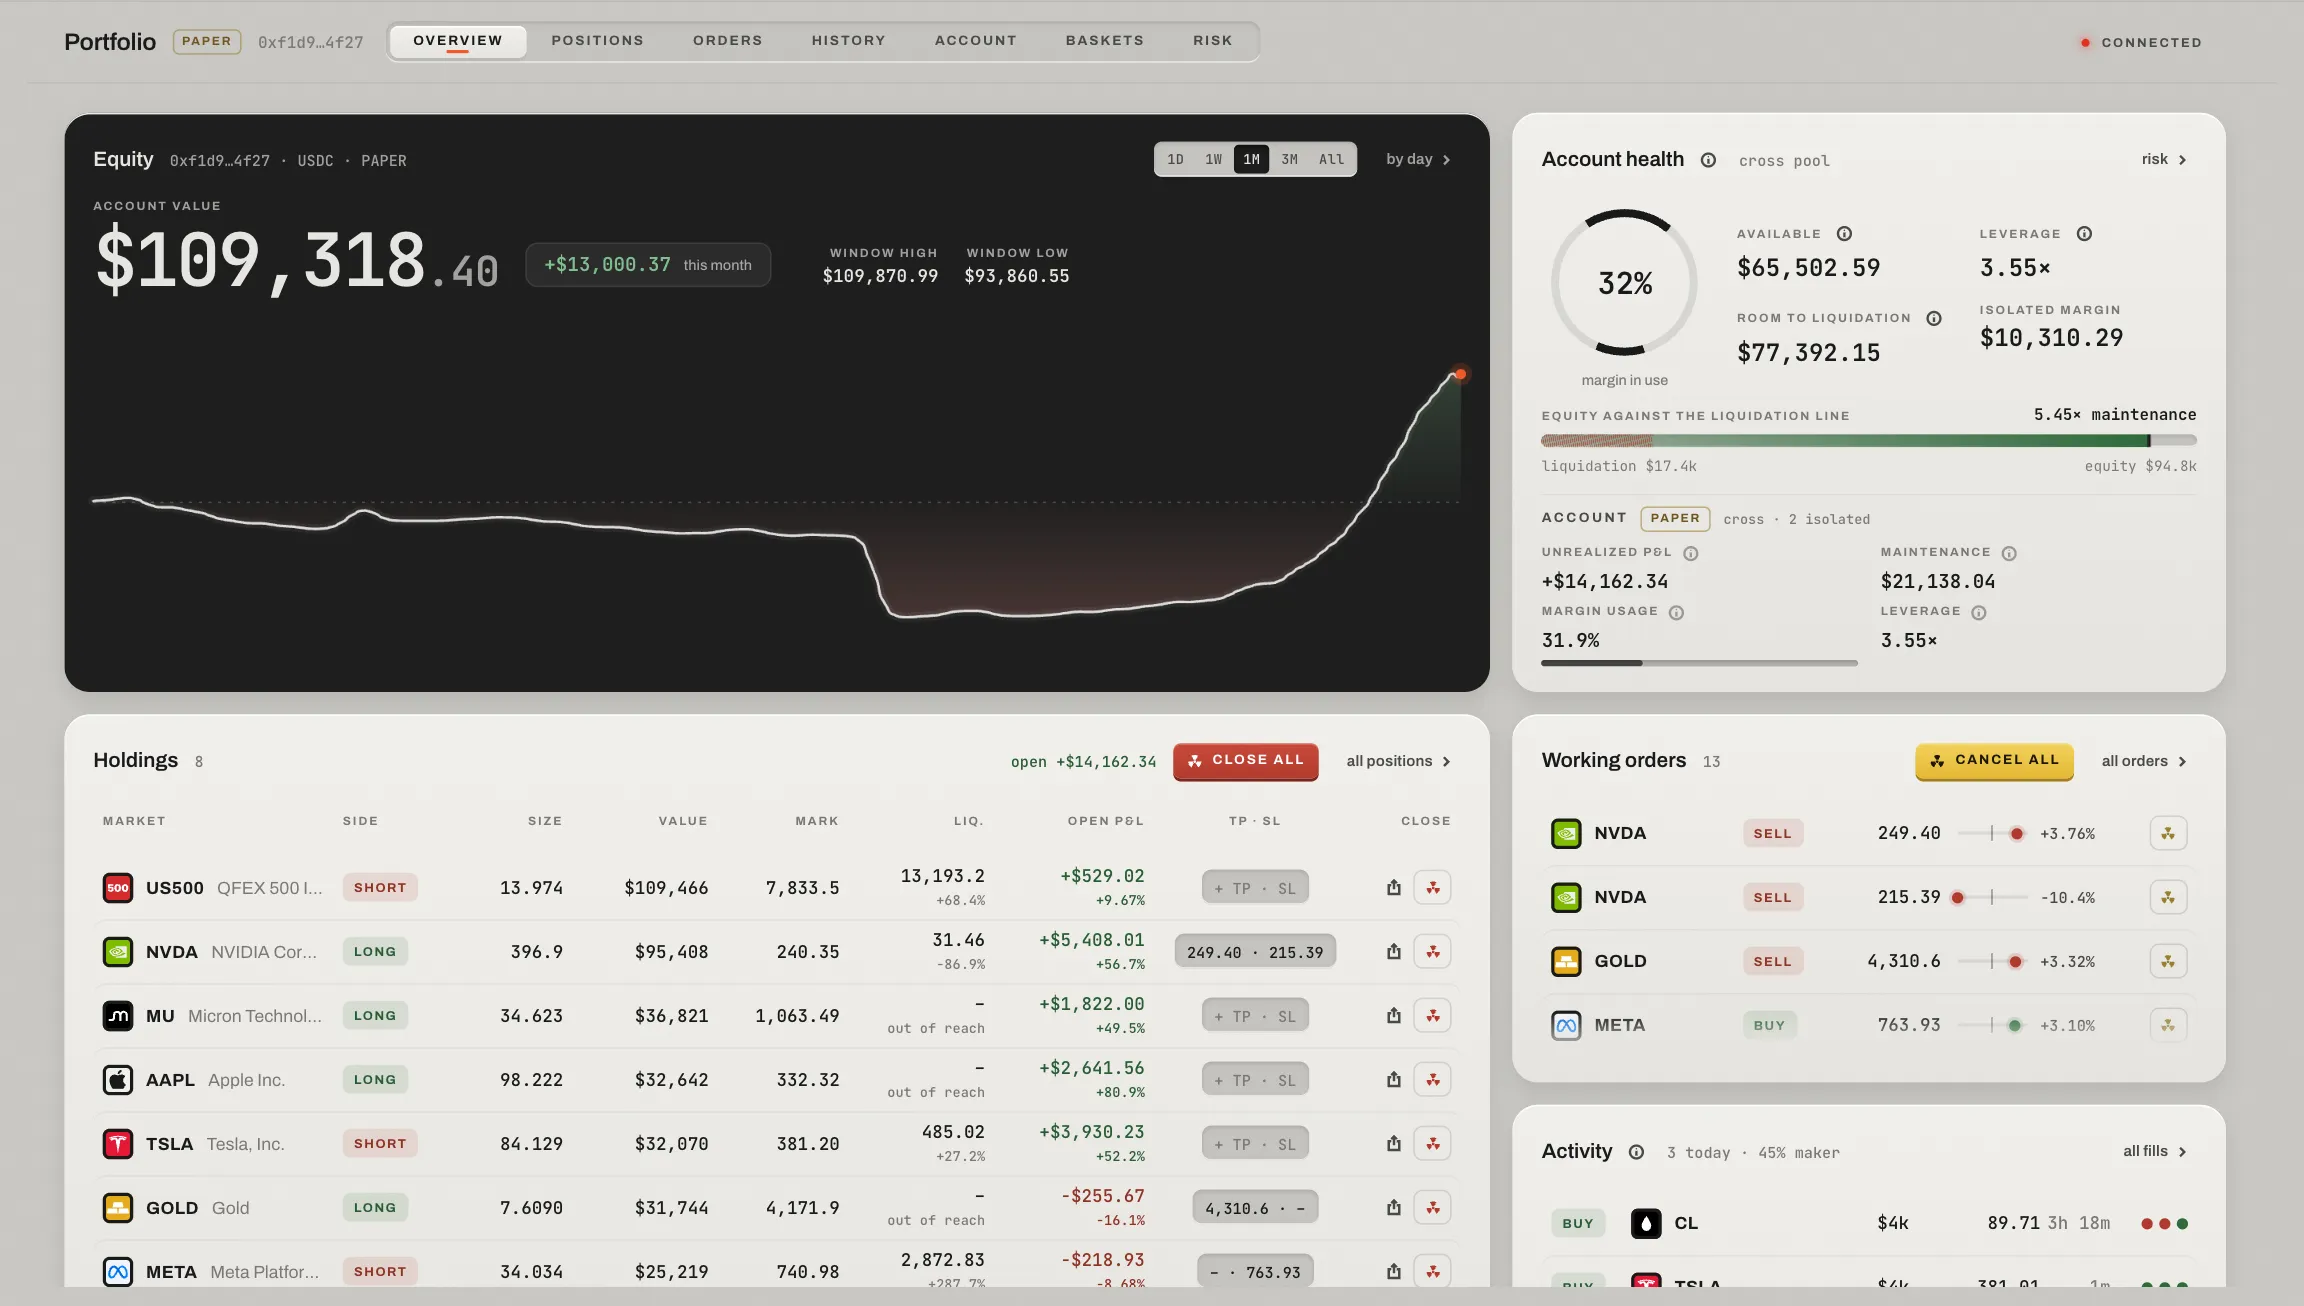
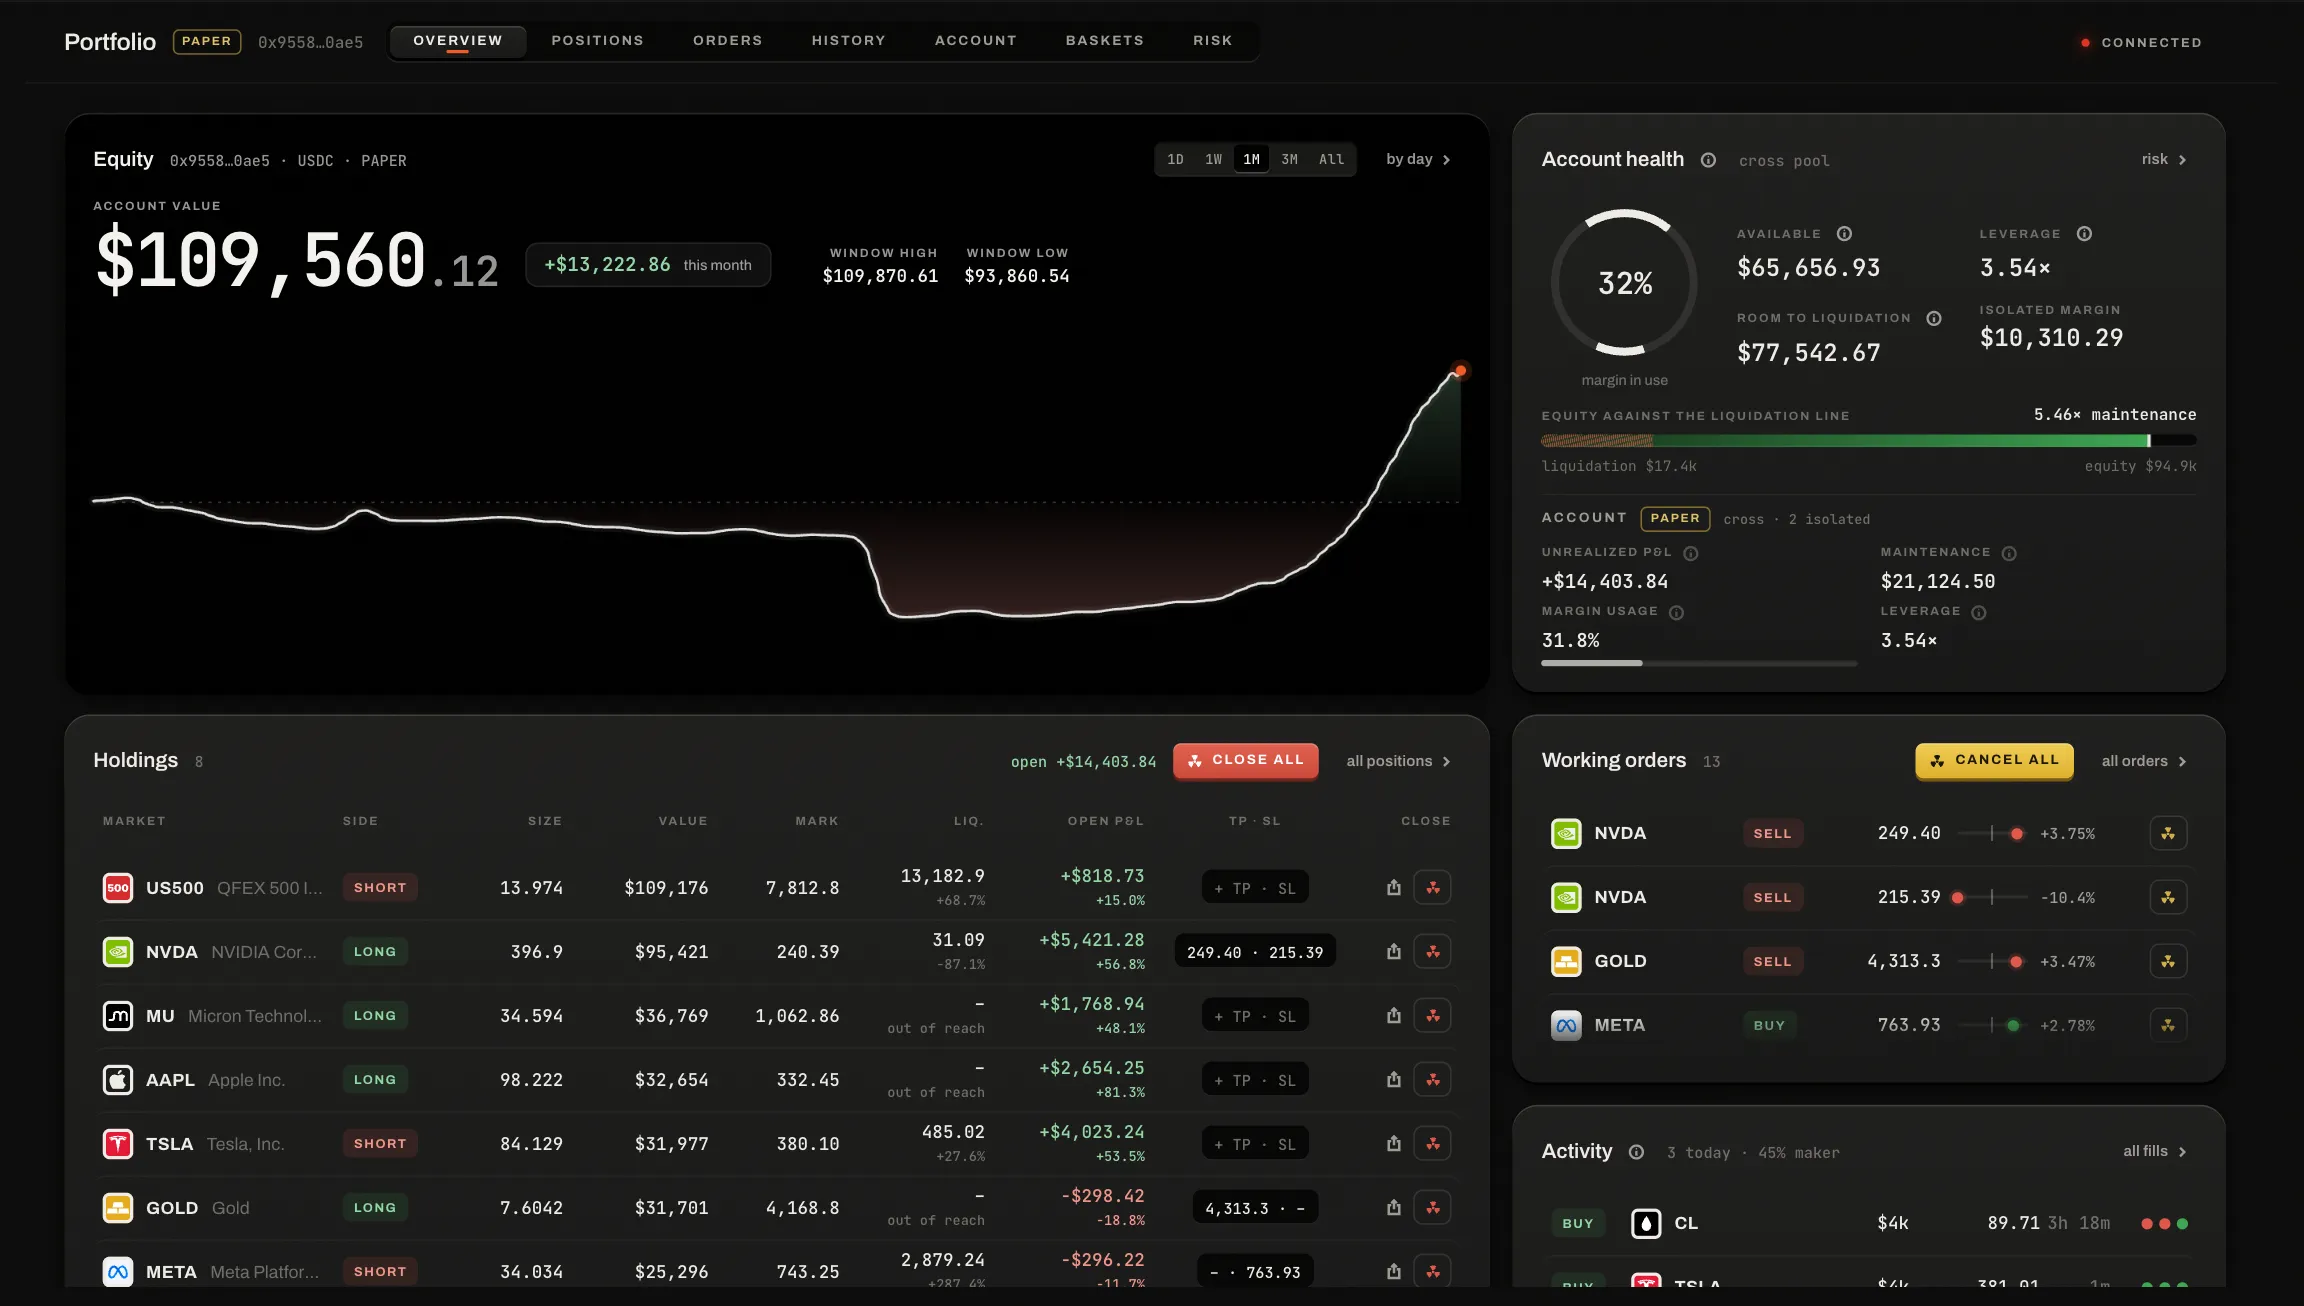
The Portfolio's first screen on the sample data.
P&L and execution analytics
Every position, order and round trip is read whole beside its table: what made its P&L, the fees and funding it paid, and for each fill the slippage against the mid and the markouts. Equity, drawdown, fee tier and funding each have a page.